Viewing Tracer results in the Tracer window
To maintain the quality of your application, you can use the Tracer window to interact
with Tracer results. Each row in the window represents an event. The Tracer records selected
events from the rule executions, database operations, and other event types that you select when
you configure the Tracer. The Tracer helps you debug your applications and improves the quality of your software
for users. By analyzing results in the Tracer window, you can obtain more information about how
your application runs in the system, as well as find and fix any issues. The way the tracer results window groups information depends on the type of your
application. If you use a standard Pega Platform application, the header
row of the tracer results window contains the Pega node hash
and computer name. For cluster-wide tracing of service rules, the tracer displays a separate
section for each node that reported events. For applications that rely on the Cosmos React, the Tracer results
window groups the data by request ID. Because in the Cosmos React
applications multiple requests can be active simultaneously, grouping events by requests ID
provides more clarity, so that you can find relevant information faster. The tracer records selected events from the rule executions, database operations, and other
event types that you select when you configure the Tracer. Each row represents an event and
is color-coded in the following way: The following table contains columns that you find in the Tracer results window. The values
of some columns change depending on the type of event that you trace. Rules other than activities are not assigned a
number. For a declarative rule or decision rule, the value indicates the start or
end of a computation. For a when condition rule or Boolean expression, the
value identifies the rule name or the expression. When you trace a database
operation, this column lists the specific operation performed on the database, for
example commit, insert, or update. When you trace a database operation, this column lists the database table
affected by the database operation in the Step Method column. Exit Iteration
marks the end of an iteration step. In this context, a red Fail row
indicates an unhandled exception condition. If a method returns a
Fail status but the step contains a transition, the
Tracer row displays the status as Good and has a gray
background. This behavior is consistent with the processing status that the next
activity step to run perceives. The Good status
reflects that the activity notes any existing error condition. When you
trace a database operation, this column lists the number of bytes involved in a
write to the database. When you trace
a database or cache operation, the Name and
RuleSet columns are combined. The text in this combined
column provides details on the rules that the system searches for in the cache, or
on the size of the database operation.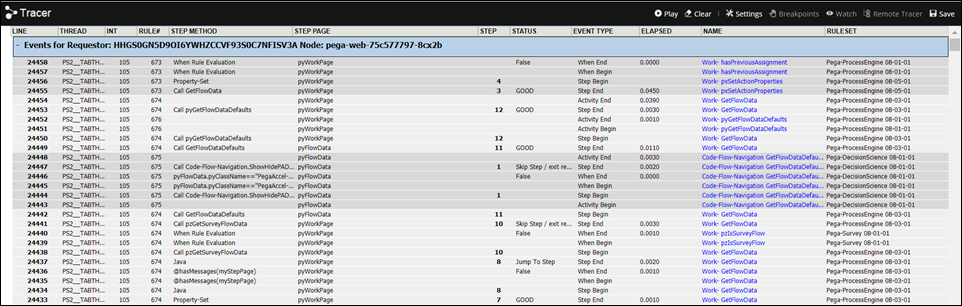

Tracer results window
Column Description Line Number of events traced, where 1 marks the oldest event. Thread The Thread object for the step. Int The interaction number for the step. The system starts tracing the total number
at login and resets upon logout. Rule# Count of distinct activities that are traced. The count is not reset to zero if
you clear all the events. When a single activity runs again later, the previously
assigned number is repeated. Step Method For an activity, the value indicates the method that you associate with a
step. Step Page Name of the step page. If the Step Page column of this step is blank, the
window displays the =unnamed= value. Step pages that
have messages set on them, such as error messages, have a bright orange background.
Step Step number of this step. If two or more rows appear with the same step number, an iteration is in process at that step. Status Status of the method in the step that the system derives from the
pxMethodStatus property, such as
Good, Fail, or
Warn. A red background marks steps that fail and that
are not addressed by a transition. Watch Properties for which you set up a watch variable. Event Type Type of event or rule, such as Step Begin,
Step End, Activity End,
Constraint, Expression,
DecisionTree, or
MapValue. The Begin and
When End events identify the start of a when
condition rule or a similar test, such as in a precondition or transition. Elapsed For Step End and Activity
End rows, the value defines the elapsed time in seconds for the
step. A Tracer operation might decrease the time interval value. Name Full name of the rule that Tracer traces, with all key parts. Ruleset Ruleset and version that contains the rule that Tracer traces.
Previous topic Cluster-wide tracing of service rules Next topic Offline debugging by using Pega-TracerViewer