Dashboard management
You can increase the productivity of your team by configuring a dashboard that
consolidates and presents relevant data in the most convenient form. For example, you can
design a workspace that includes a number of reports that help managers oversee work by
displaying case status, sales data, and burndown report widgets. At run time, end users can personalize their dashboard instance to adapt information display
to their specific preference and interact with data in the most convenient way. The developer can configure the dashboard, which is available as a custom
page in an application, for a role by publishing changes to the default dashboard. For
example, the manager might see the number of open cases and overdue assignments, to better
manage the workload of their direct reports. Then, end users can access the published
default dashboard that is assigned to their role. The end user can personalize their
dashboard by switching templates and adding or removing widgets from slots. A template
defines the layout of a dashboard and divides the workspace into slots. Slots are containers
for one or more widgets, which are elements of the user interface that consolidate summary
information and Key Performance Indicators (KPIs) from different sources and present it in
an actionable format. If end users personalize a dashboard, changes that developers publish
to a default dashboard do not override or reset the personalized dashboard of the end
users. Find basic information that you need more efficiently by organizing your
dashboard layout in a comprehensive and transparent way. Dashboards that offer quick
access to information that is necessary for a particular role can help increase
productivity. Increase the productivity of your team by personalizing the dashboard with
widgets that display relevant information, such as charts or shortcuts to reports and
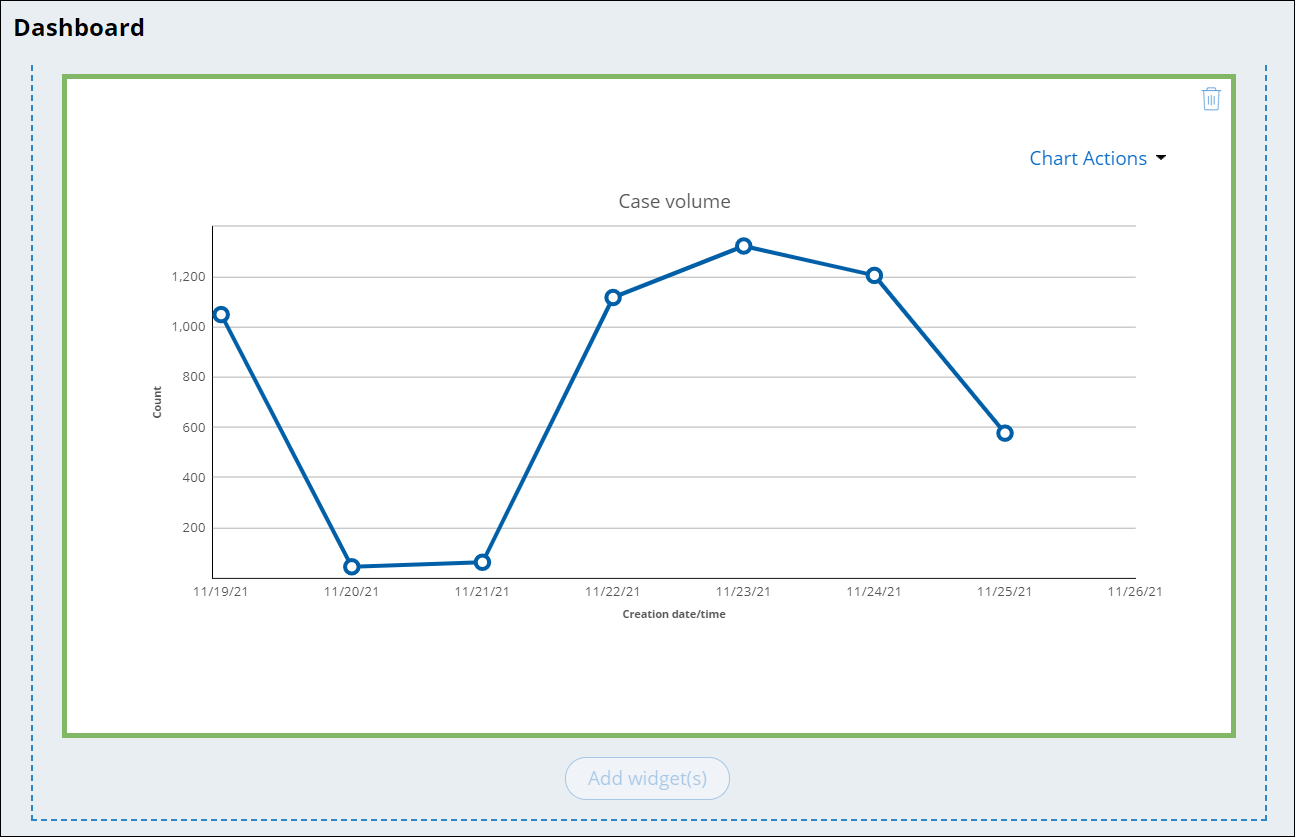
frequently used resources. A dashboard widget displays operational information about your application and key
performance indicators, such as the number of assigned items or the average time to resolve a
case. By personalizing your dashboard with widgets that are relevant to your role, you can
increase productivity. The following table lists the widgets that you can add to your dashboard in a Theme Cosmos application: Options include changing the
title of the widget and the visibility of the Quick Create
option. Options include selecting the case type and the
Location property. Options include
changing the source of the list to a specific work queue or work group. Options
include selecting an automatic or fixed height for the map. Options include setting the visibility of the widget
title. Click a report title to view
the result data. Options include setting a report
category and name.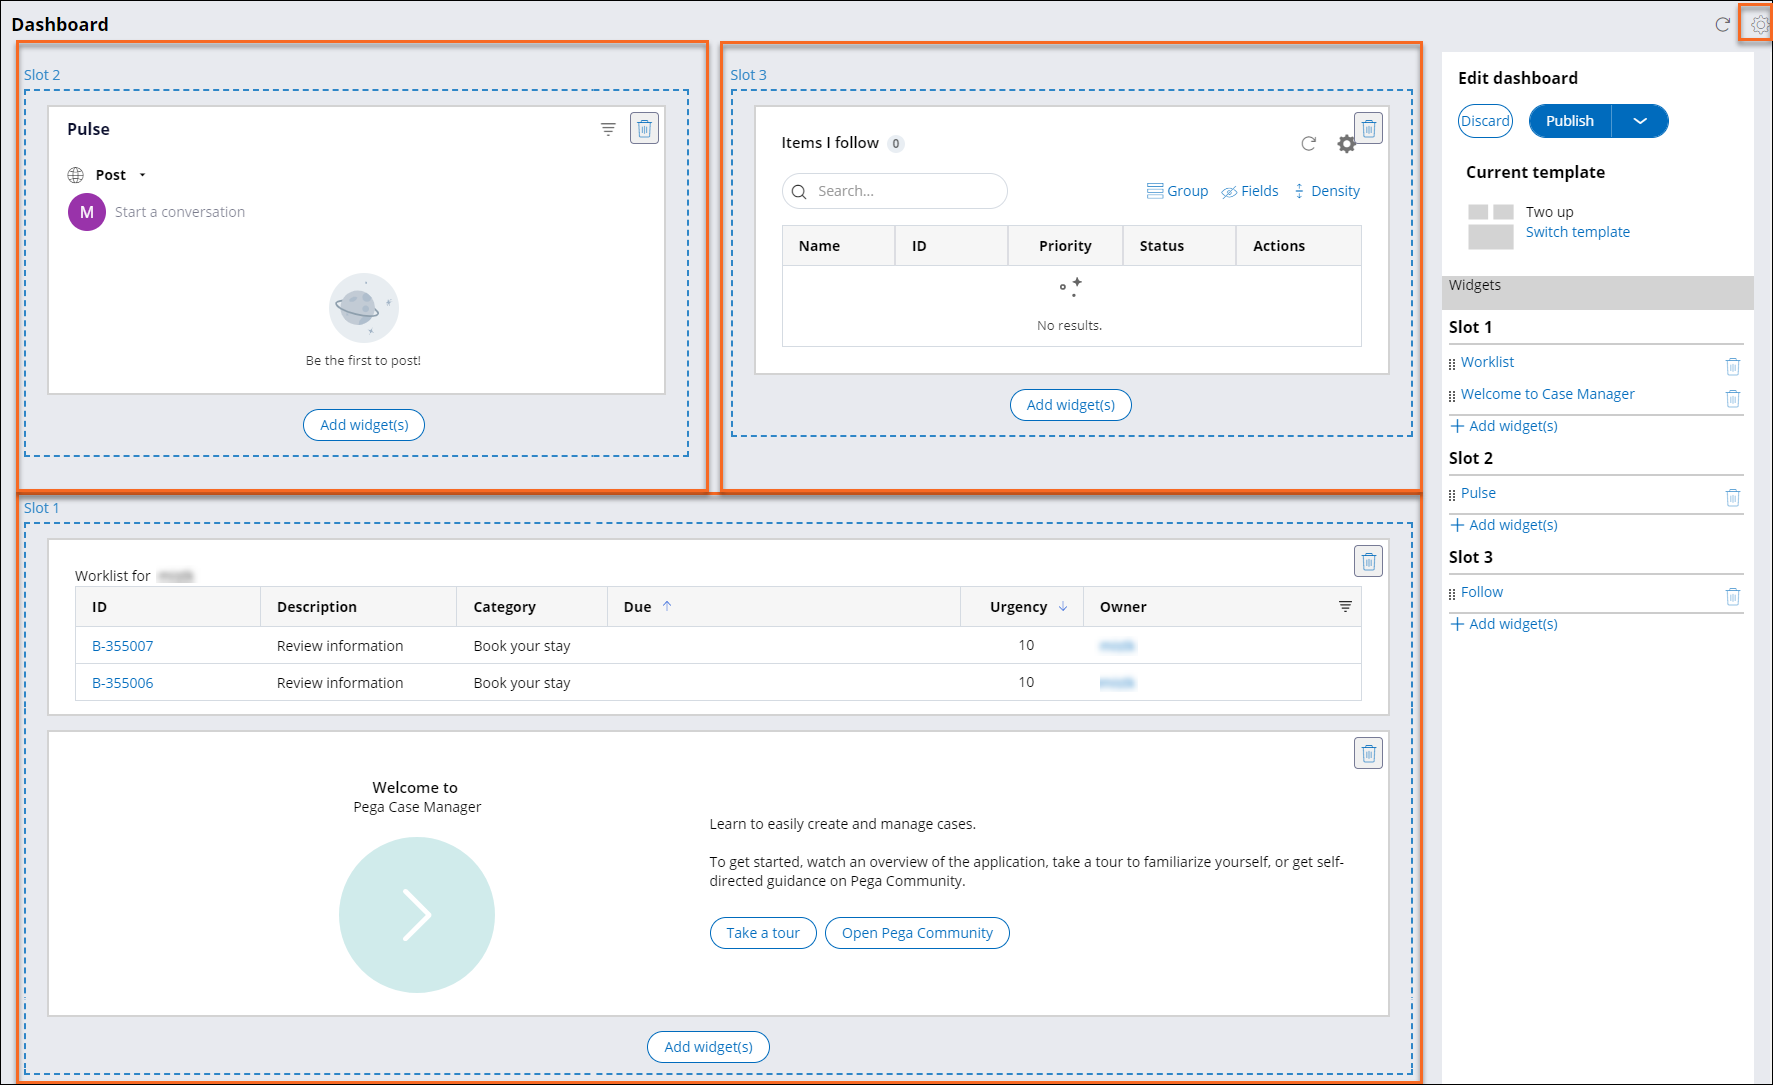
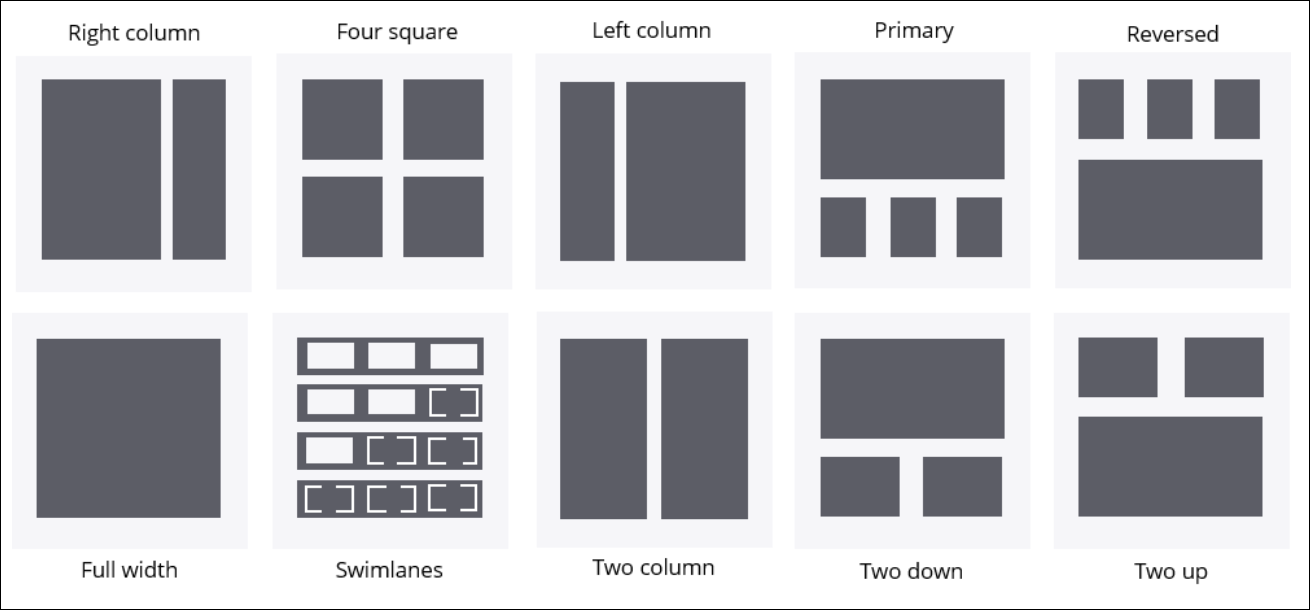
Changing the dashboard template
Adding a widget to your dashboard
Choices Actions Click to edit message on hover No options message on hover Click Publish. Dashboard widgets
Widget Description Configurable Case lifecycle Displays the stages and steps for each case type in your application. No Case Manager shortcuts Provides shortcuts to the Reports and Get next
work items. No Cases entered by me Displays all cases that you create. No Case status Renders a pie chart that breaks down cases by stage. No Connected Apps Displays a list of third-party apps and their connection status. You can also
connect and disconnect apps from a service provider. No My Cases Displays all open cases to which you are a party. Yes Nearby Cases Displays cases within a maximum radius of 50 miles from your current
location. Yes Recents Displays a list of cases that you recently updated or opened. No Team members Displays the users in your work group and the number of their open
assignments. No Teams Displays a list of teams within your work group. No Work queues Displays a list of work queues in your application. No Worklist Displays a list of work items that are assigned to you. Yes Data Imports - In-progress Displays the details of currently running data imports. No Data Imports - Recently completed Displays the details of recently completed data imports. No Achievement Tracker Displays badges that you receive by accomplishing specific tasks in the
product. No Google Maps Displays a map that shows your current location and open assignments. Yes Welcome to Pega Express Displays introductory information about the product and an overview
video. No Welcome to Case Manager Displays introductory information about the portal and an overview video. No Manage Change Displays data types that are delegated to you by a manager. Yes Recent reports Displays a list of reports that you ran recently. No Report widget Displays the results of a specific report. Yes Pulse Activity Feed Displays the Pulse activity gadget that displays Pulse posts made by the user. No
Previous topic Creating suggested tags for cases Next topic Best practices for managing interactions between parent and child cases