Managing data flow runs
Control record processing in your application by starting, stopping, or restarting data flows. Monitor data flow status to achieve a better understanding of data flow performance.
- In the header of Dev Studio, click .
- On the Data Flows landing page, select the data flow type that
you want to manage:
- To manage data flows that use a non-stream data set as the main input, click the Batch processing tab.
- To manage data flows that use a streaming data set (such as Kafka, Kinesis, or Stream) as the main input, click the Real-time processing tab.
- To manage data flows that are triggered in the single case mode from the DataFlow-Execute method, click the Single case processing tab.
- In the Action column, click Manage.
- In the Manage list, select whether you want to
Start, Stop,
Continue or Restart a data flow run.The available actions depend on the current data flow run status. For example, if a data flow run status is Completed, the available actions include Restart.
- Optional: To display detailed information about the data flow run, click a run ID in the
ID column.You can view the following details:
- Component statistics
- View the number of successful and failed records per data flow component and the average processing time (in milliseconds). You can also view the percentage of the total processing time that your application took to process each component.
- Distribution details
- View the number of data flow nodes that were assigned to process the data. You can also view the number of partitions that were created to process the data in each decision data node. The statistics display the number of records processed by each node, the number of failed records, and the current status of the node.
- Run details
- The default parameters of the run.
- Optional: To display detailed information about partitions, on the Distribution
details tab, click the number in the # Partitions
field.
Partitions count in a data flow run 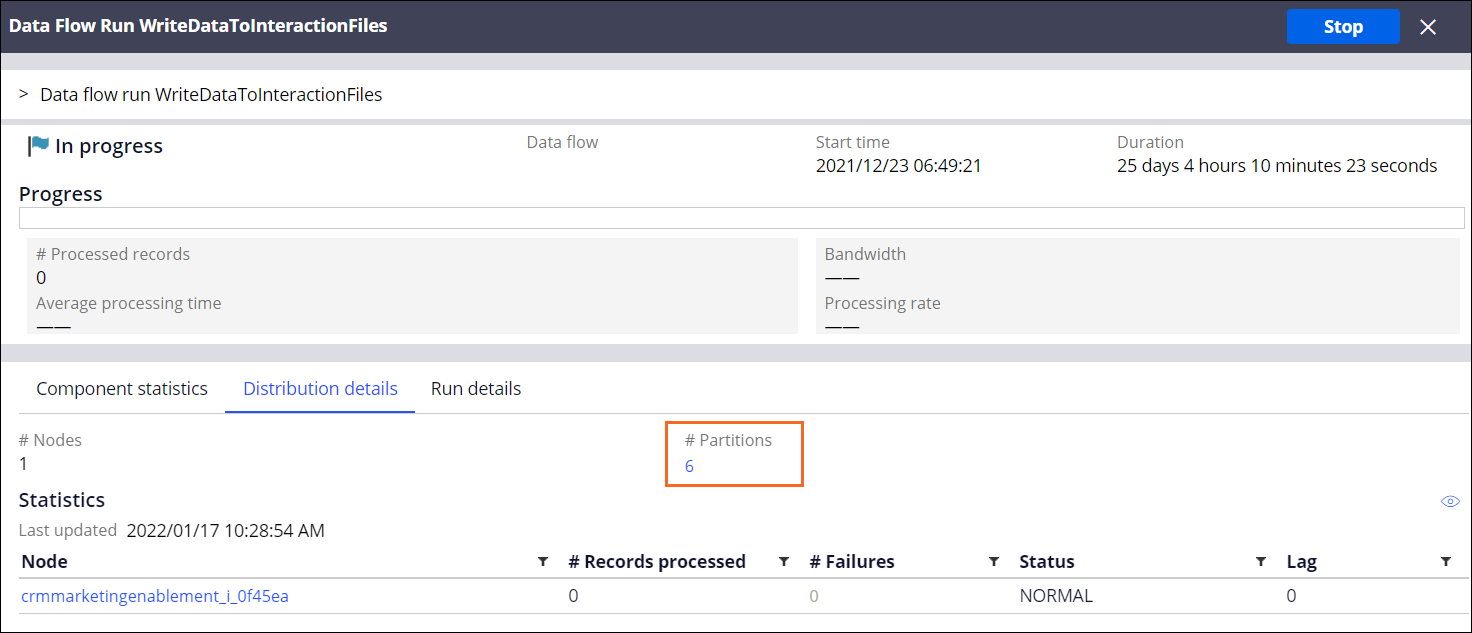 Result:
The partitions report displays the metrics for individual partitions.
If you changed the number of partitions of a topic associated with a queue processor or a streaming data set (Kafka, Kinesis, or Stream), the related data flow run automatically detects the change and adjusts the metrics accordingly. The Intention column contains messages for added and deleted partitions.
If you added partitions, the new partitions are added to the table and marked to be picked up:
Partitions report with partitions marked to be picked up 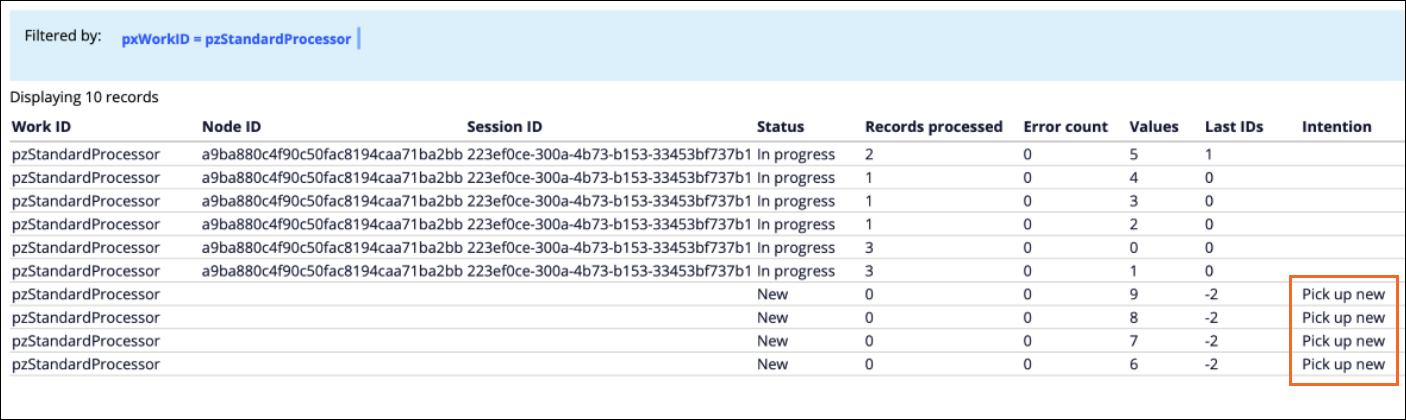
If you removed partitions, these partitions are stopped and marked for deletion:
Partitions report with partitions marked for deletion 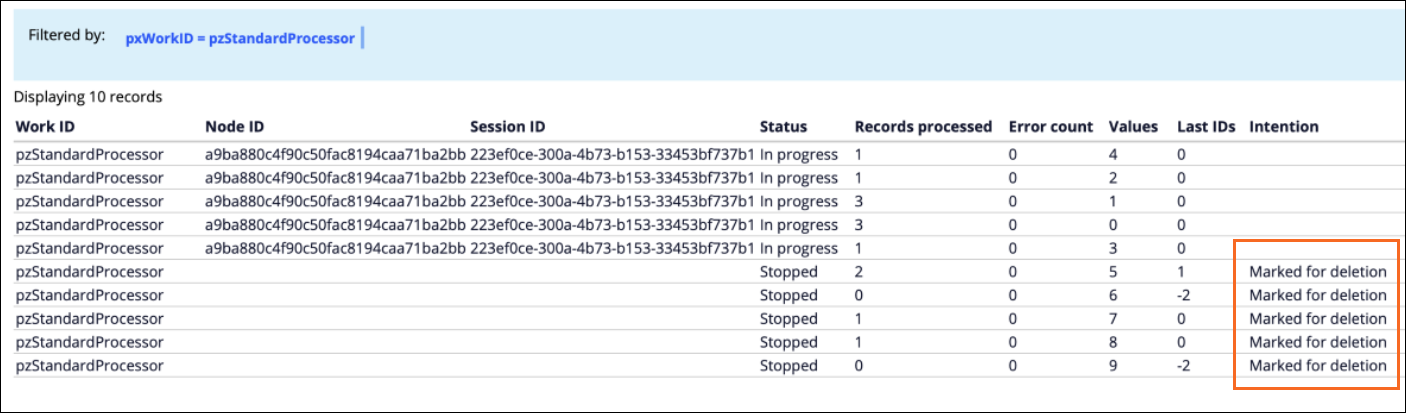
For previously active partitions that were removed, a separate entry is added to the table. This entry provides aggregated metrics of previous partitions: the number of records that these partitions processed when they were active and the number of errors that these partitions had.
Partitions report with aggregated metrics of previous partitions 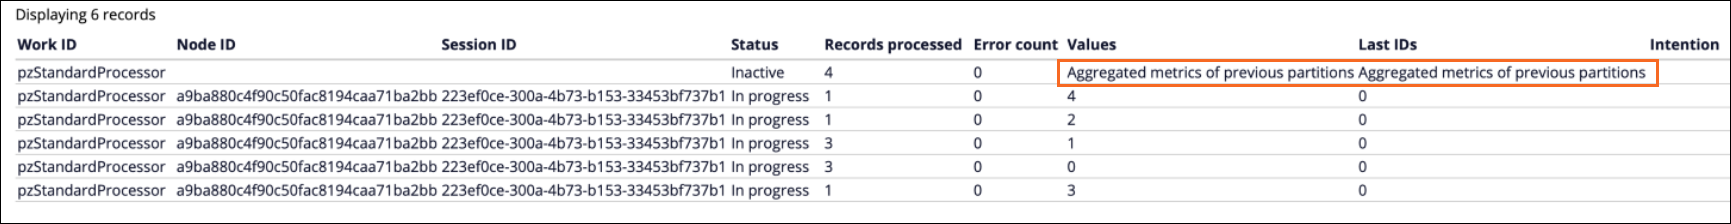
- Optional: To display the data flow configuration, click the name of a data flow rule in the Data flow column.
Previous topic Monitoring single case data flow runs Next topic Data flow run limits