Guided development through guardrails
Pegasystems promotes a set of best practices for design and implementation of PRPC applications. This approach includes guardrails -- guidelines that guide the development team to the highest project success, including optimal reuse, maintainability, and system performance. This article describes how to use the features and tools available in PRPC 6.3 to ensure that all non-essential warnings are addressed, and that violations are caught and rectified as early as possible in the course of application development.
Suggested Approach
- What are guardrails and how are they important to PRPC application development success
- How to use rule warnings in PRPC 6.3 to guide development
- How to create custom rule warnings
- Final thoughts
What are guardrails and how are they important to PRPC application development success?
Basically, guardrails are best practices and guidance about situations that contain risky conditions or that might result in an undesirable outcome. Pegasystems professionals identify guardrails from developing, testing, and reviewing PRPC applications in a variety of industries and organizational settings. Guardrails ensure you and your team use PRPC according to their guidance, and help you avoid troublesome situations.
For example, using inline styles in sections violates Guardrail #3 because writing inline styles is more error prone, is harder to maintain over time, and makes it difficult to upgrade. To ensure that developers are alerted to avoiding the use of inline styles in sections, when a section rule is saved, the system displays a warning message if the rule contains inline styles.
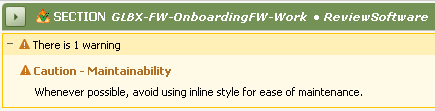
Unlike error conditions, the system still saves rules that have warnings, because applications can still run and process cases and work items even if the underlying rules have warnings. However, even though the application can run, because these warnings are typically alerts for improving performance, maintainability, usability, and reuse, it is strongly recommended that you revise the rule to remove as many warning conditions as feasible.
See the PRPC 6.3 Dictionary of Rule Warnings to find out more about the standard warnings conditions available in PRPC.
See also:
Ten Guardrails to Success
Top Ten Usability Guardrails
How to use warnings in PRPC 6.3 to guide development
Warnings serve to alert the development team when rules or data instances have options or conditions that violate the guardrails. Use these warnings to identify aspects of the application that are not aligned with the guardrails, and then make an informed decision about:
- How they relate to the needs of your organization and users
- Where you will make exceptions (and retain the rule warning)
- Where you will make changes that conform to the guardrails (and remove the rule warning)
The PRPC 6.3 Designer Studio provides warning information in a number of areas, including:
- Dashboard, Summary, and All Warnings tabs of the Guardrails landing page
- Scheduled warnings reports
- Rule and data forms
- New Rule form (for some rule types)
- What's Happening (event feed)
- Recent Actions tab of the Development landing page
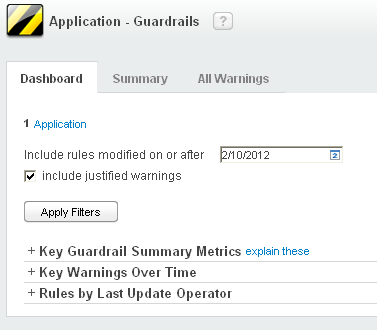
Dashboard landing page tab
Use the Dashboard tab to answer questions such as:
- If we went live today, what high severity warnings exist that would adversely impact production?
- If we needed to go live today, what might stop us from doing so?
- Are we going outside of the model and introducing a testing, maintenance, or upgrade problem that would affect us now or in the future?
- What is the trend of key unresolved warnings over time from the start of this phase of the project?
- Who is introducing the warnings?
According to the selected filter criteria, the Dashboard tab displays charts that visually provide the answers to those questions.
Example: Guardrails Dashboard tab
Filtering the displayed data
The fields at the top of the tab indicate the criteria used to scope what is displayed in the grid. These fields scope the reported data to that which fit the specified criteria:
- Application filter — Click to specify those applications in the built-on stack that you want to include in the displayed data. The default selection is the current application (the one currently displayed in the Application menu in the Designer Studio header).
- Include rules modified on or after — Specify a date. Data that fits the criteria is included in the charts.
- include justified warnings— Select this checkbox to include rules that have justified warnings in the data presented in the charts.
Note: Justifying a warning in a rule is a useful way to communicate to project stakeholders the acceptable reasons for not altering the rule to remove the warning condition. To justify a rule warning for a particular rule, open the rule, expand the warning section, and click the Justify Warnings link (
 ) on the right hand side of the section.
Note: After selecting a new date or changing the setting to include justified warnings, click Apply Filters to update the display according to your selections.
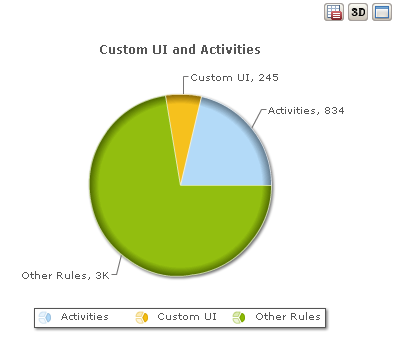
Key Guardrail Summary Metrics
The charts in this section answer questions such as:
- If we went live today, what high severity warnings exist that would adversely impact production?
- If we needed to go live today, what might stop us from doing so?
- Are we going outside of the model and introducing a testing, maintenance, or upgrade problem that would affect us now or in the future?
Example of an application's key guardrail summary metrics
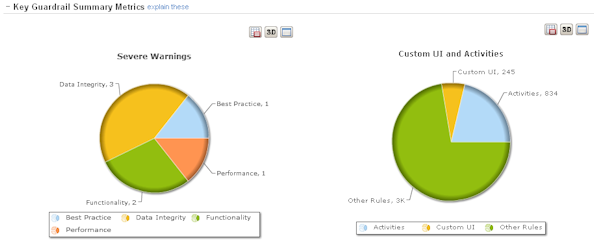
For example, use of custom code (such as hand-coded HTML used in user-interface-related rules or custom Java in activities) makes rules difficult to test and upgrade, and thus poses the risk of potential maintenance issues in the future. The displayed chart helps you assess the level of custom code present in the application.
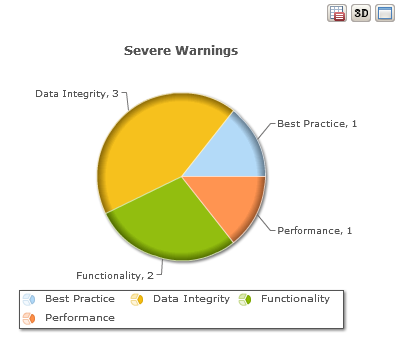
The Severe Warnings chart provides an immediate view of how many rules have severe warnings, and which warning category has the greatest count. This chart can help you determine in which category the greatest risk lies if the application went live today. For example, in the following chart, the area of highest risk is in data integrity.
Key Warnings Over Time
This chart answers questions such as:
- What is the trend of key unresolved warnings over time from the start of this phase of the project?
- Is the quality of the application (as measured by the number of warnings) getting better or worse over time?
The start date in the chart is the date specified in the Include rules modified on or afterfield.
![]()
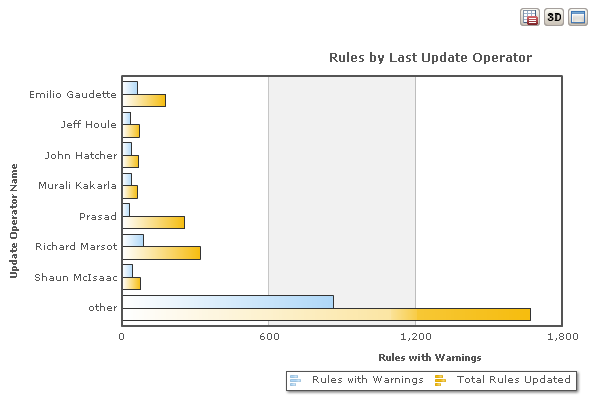
Rules by Last Update Operator
This chart answers the question: Who is introducing the warnings?
Interacting with the charts
The charts on the Dashboard tab are interactive:
- Roll over a portion of a chart to see details about the underlying data for that portion.
- Click
 to see a summary report of a chart's underlying data.
 - Click
 to see the data represented in 3-D (and click
  to return to the 2-D view).
 - Click
 to see a maximized view of the chart.
 - Click the items in the legends at the bottom of a chart to show or hide that data.
Summary landing page tab
Use this tab to see the extent and level to which rules in the application have warnings. On this tab, you can:
- Get a high-level idea of how many rules (number and percentage of total) have warnings
- Filter the results by application, Applies To class, timespan in which the warning was introduced, severity of the warning, and whether the warnings are justified.
- View lists of rules with warnings by rule type.
- Schedule the Guardrails Summary report to run on a recurring basis and have it emailed to users, by clicking Schedule Report. (See Scheduled warnings reports in this article.)
According to the selected filter criteria, the Summary tab displays colored bars that visually indicate a summary of the number of the application's rules with warnings and the number of warnings by severity. The tab also displays summaries of that information broken out by rule type.
The bar charts give you an immediate sense of where rule warnings are concentrated in your application by rule type — the longer a colored bar, the greater the concentration of warnings. The red bars in the Warnings by severity chart indicate severe warnings. You can quickly narrow in on where the severe warnings are.
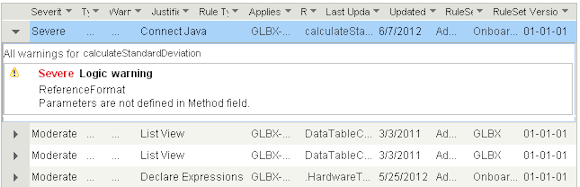
Example: Guardrails Summary tab
![]()
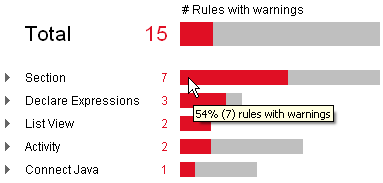
For example, the data depicted in the example indicates:
For the set of rules in the application (and all of its Applies To classes) that were last updated between January 3, 2011 and June 8, 2012, there are fifteen (15) rules with warnings, and a total of eighteen (18) warnings altogether among those fifteen rules:
- 7 sections have a total of seven warnings
- 3 Declare Expression rules have a total of three warnings
- 2 List View rules have four warnings among them
- 2 activities have three warnings among them
- 1 Connect Java rule has one warning
Filtering the displayed data
The Application | Classes fields at the top of the tab indicate the criteria used to scope what is displayed in the grid. These fields scope the reported data to that which fit the specified criteria:
- Application filter — Click to specify those applications in the built-on stack that you want to include in the displayed data. The default selection is the current application (the one currently displayed in the Application menu in the Designer Studio header).
- Classes filter — Click to specify those Applies To classes that you want to include in the displayed data. The default is to display data for all classes in the applications specified by the Application criteria.
In addition to application and Applies To class, you can scope the displayed data according to:
- Time period in which the rule was last updated
- Adjust the From date and To date fields to investigate the time period in which the warnings appeared in the rules. Rules that were last updated within the specified time period and have warnings are included in the displayed data.
- Severity
- Use the checkboxes to include or omit rules according to the severity of the rule warnings.
- Justification
- Use the checkboxes to include or omit rules that have justified warnings.
Note: Justifying a warning in a rule is a useful way to communicate to project stakeholders the acceptable reasons for not altering the rule to remove the warning condition. To justify a rule warning for a particular rule, open the rule, expand the warning section, and click the Justify Warnings link (
) on the right hand side of the section.
After making selections for the time period dates, the severities, or justifications, click Apply Filter to update the display according to your selections.
Hover over the bars in the Rules with warnings chart to see the count as a percentage of rules of that type. For example, the following image shows the details about sections with warnings as a percentage of the total number of sections:
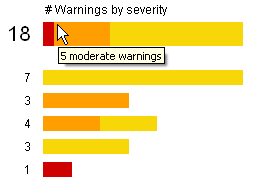
Hover over the bars in the Warnings by severity chart to see the counts reported for each severity:
Expand the row for a rule type to see the details about the included rules. For example, the following image shows the details about the Declare Expressions rules with warnings:
![]()
As for most grids in the Designer Studio, you can click the rule name to directly open the rule and examine its warning messages.
All Warnings landing page tab
Use this tab to:
- Review the application's warnings in a table format.
- Download the table as a Microsoft Excel spreadsheet for offline analysis, by clicking Export to Excel.
- Schedule the Guardrails Detailed report of all of the warnings to run on a recurring basis and have it emailed to users, by clicking Schedule Report. (See Scheduled warnings reports in this article.)
According to the selected filter criteria, the All Warnings tab displays the total number of warnings, followed by a table of rows and columns. Each row is a warning.
Example: Guardrails All Warnings tab
![]()
Filtering the displayed data
The Application | Classes fields at the top of the tab indicate the criteria used to scope what is displayed in the table. These fields scope the reported data to that which fit the specified criteria:
- Application filter — Click to specify those applications in the built-on stack that you want to include in the displayed data. The default selection is the current application (the one currently displayed in the Application menu in the Designer Studio header).
- Classes filter — Click to specify those Applies To classes that you want to include in the displayed data. The default is to display data for all classes in the applications specified by the Application criteria.
To sort the display by a column, click the label in that column's heading. For example, to group the table rows sorted by rule type, click the Rule Type column heading. If a column has a down arrow next to it, you can filter the displayed data according to the values in that column by clicking the down arrow and selecting only the values you want to see. For example, to see the warning data only for activities, click the down arrow next to the Rule Type heading, select Activity, and click Apply. The display refreshes to show rows only for activities.
Expand a row for a warning to see the details about all warnings in the rule that is associated with that row of the table:
Scheduled warnings reports
On the Summary and All Warnings tabs, you can schedule the system to generate the warnings report on a recurring basis, and optionally email it to stakeholders.
To schedule a recurring report:
- Click the landing page that corresponds to the report you want to schedule:
- Summary tab to schedule a summary report
- All Warnings to schedule a detailed report
- Optional: Set filters for the reported data. The system uses the filters that are in effect on the landing page tab at the time you schedule a report from that tab.
- Click Schedule Report to open the Schedule Guardrails Report window.
- In the Schedule Guardrails Report window, specify:
- How often to send the report (
DailyorWeekly). - Whether to send notifications to system users. If you select to send notifications to users, click
 to add a row for each user's ID, and then use the autocomplete
  in each row to select the user.
- How often to send the report (
- Click Submit.
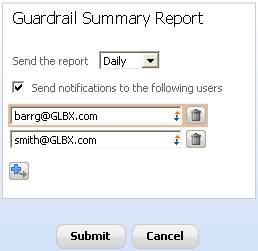
The system runs the report according to the chosen time period. When the option to send notifications is selected, the system emails a notification message to the specified users each time the report is run.
To unsubscribe a user from receiving email notifications, remove their name from the list in the Schedule Guardrails Report window.
After the first time a report has been scheduled, the system generates the report according to the configured interval as long as there is at least one user listed to receive notification.
Rule and data forms
When a rule or data form contains aspects that are not aligned with the guardrails and is saved, the system sets a warning condition for that saved instance and displays a warning message in the form. At that moment, the person saving the form is alerted to the issue. (See PRPC 6.3 Dictionary of Rule Warnings to find out conformance steps available for each warning.)
Note: An organization can control which warnings are displayed on a rule form by overriding the standard Embed-Warning.ShowWarningOnForm decision tree. For example, you can suppress the display of all warnings that have a Caution severity level (pxWarningSeverity = 3). However, even when the warning information is suppressed from displaying on rule forms, it is available in the system and is included in warning reports and counts displayed in other areas of the Designer Studio.
New Rule forms for some rule types
For some rule types, the system displays warning messages in their New Rule forms (the dialog that appears when you create a new rule from scratch. These warning messages are an alert that there are preferable alternatives, which might be a better fit to accomplish the desired outcome.
For example, when you open the New Rule form for a List View rule by clicking ![]() > Reports > List View, the system displays at the top of the New Rule form:
> Reports > List View, the system displays at the top of the New Rule form:
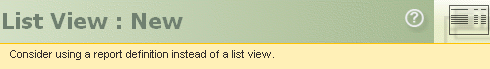
Because report definition rules provide more flexible and powerful customization and personalization from the run-time report display, they are the preferred alternative to List View rules, and the warning message in the New Rule form alerts you to that fact.
Those rule types whose New Rule forms display a warning message are:
- Activities
- Form rules
- HTML rules
- JSP rules
- List View rules
- Summary View rules
Note: Form rules and JSP rules are deprecated in PRPC V6.3.
If you want to remove display of the warning in the New Rule forms for a listed rule type, override the @baseclass.pyRuleCreationWarning decision table in your application, and remove the rule type from the decision table.
If you want to provide a custom warning in the New Rule form for a rule type not in the list:
- Override the @baseclass.pyRuleCreationWarning decision table and add the rule type to it.
- Override the standard section @baseclass.pyRuleCreationWarning at the rule type's class level and provide the custom warning inside the section. See Rule-Obj-Activity.pyRuleCreationWarning for an example. (A best practice is to use a field value to provide the text for the message in the section.)
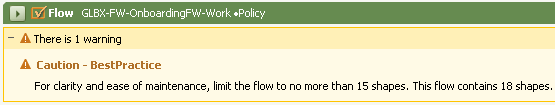
What's Happening (event feed)
The What's Happening area of the Designer Studio home page displays which rules of the current application are being modified and by whom. (This display is sometimes called the "event feed" or "Newsfeed".) When rules that have warnings are checked in, the system posts a message to this display that displays the number of warnings and how many are justified warnings (if any). You can click on the displayed rule name to open the rule form and review the warnings.
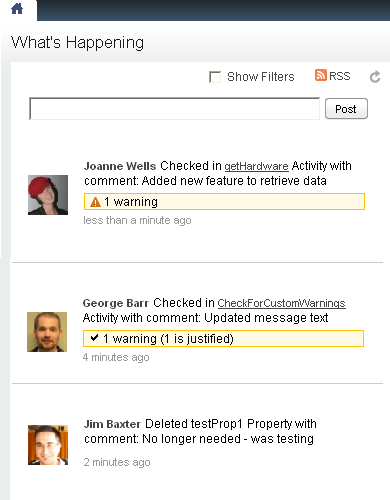
Use the What's Happening display of the Designer Studio home page to quickly see in near-real time who is currently introducing rules with warning conditions into the application. Because everyone who logs into the Designer Studio typically sees the What's Happening display immediately after logging in, and can easily locate it on the Designer Studio home page, all team members (developers, designers, business analysts) working on an application can readily see who is actively checking in rules with warning conditions, and can promptly follow up with that person to investigate the appropriateness of those actions.
Note: A What's Happening message displays all warnings associated with the rule named in the message. On rare occasions, an organization might customize which warnings are displayed in the rule forms. In these rare situations, if the organization has suppressed displaying certain warnings in the rule forms, the warning count displayed in the rule form itself can be different than the warning count displayed in the What's Happening message about that rule. For example, if an organization has suppressed the display of all warnings of Caution severity level, and a developer checks in a rule with two warnings — one Moderate and one Caution — the What's Happening message displays "2 warnings" for that rule while the rule form displays "There is 1 warning."
![]()
If you notice a discrepancy between the rule's warning count in the What's Happening display and the count displayed in its rule form, investigate whether your application is overriding the standard Embed-Warning.ShowWarningOnForm decision tree (as described in the Rule and data forms section of this article).
See Introduction to the Designer Studio for more information about the What's Happening display.
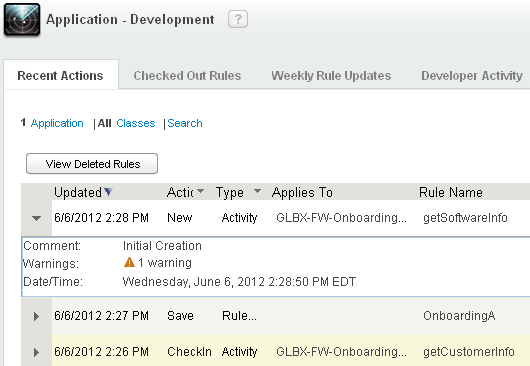
Recent Actions landing page tab
The Recent Actions tab of the Application-Development landing page displays a history of current and past changes to rules in a grid format. If a rule has warnings, the warning information is displayed when you expand that rule's row in the grid.
The Application | Classes | Search fields at the top of the tab indicate the criteria used to scope what is displayed in the grid. These fields scope the reported data to those recent actions that fit the specified criteria:
- Application filter — Click to specify those applications in the built-on stack that you want to include in the displayed data. The default selection is the current application (the one currently displayed in the Application menu in the Designer Studio header).
- Classes filter — Click to specify those classes that you want to include in the displayed data. The default is to display data for all classes in the applications specified by the Application criteria.
- search term filter — Specify a term. If a value in one of the displayed columns matches this term, the rows having that value are displayed. (Rows with no matches are filtered out.)
To sort the display by a column, click the label in that column's heading. For example, if your application has two RuleSets (A and B), and you want to review recent actions by RuleSet, click the RuleSet column heading to display the recent actions for rules in A at the top, followed by those for the rules in B. If a column has a down arrow next to it, you can filter the displayed data according to the values in that column by clicking the down arrow and selecting only the values you want to see. For example, to see the recent actions only for activities, click the down arrow next to the Type heading, select Activity, and click Apply. The display refreshes to show rows only for activities.

How to create custom rule warnings
You can add your own rule warnings, to augment the standard warnings. To add a rule warning condition involves:
- Creating an activity named CheckForCustomWarnings in the Applies To class of the rule type
- Using a Java step in the activity rule to call the standard function rule addWarning.
The CheckForCustomWarnings activity is called as part of the standard StandardValidate activity, which is called by those actions that save a rule (such as Save, SaveAs, etc). For example, when a developer saves a rule, the system calls the StandardValidate activity, which has a call to the CheckForCustomWarnings activity.
Example: Implementing a custom warning condition for a binary file rule:
The Globex organization would like all binary file rules in their applications to state usage information (using the Usage field on the rule's History tab) that indicates the binary file's business purpose and organizational source — for example, Globex's web site's Home icon is owned by their corporate marketing department and its purpose is to provide a visual affordance to bring users to their site's home page.
To ensure that the application developers are alerted to always provide this information when they save a binary file, the Globex team adds a custom warning condition for the binary file rule type (Rule-File-Binary class).
Steps to add a custom warning to alert developers to include usage information for binary file rules
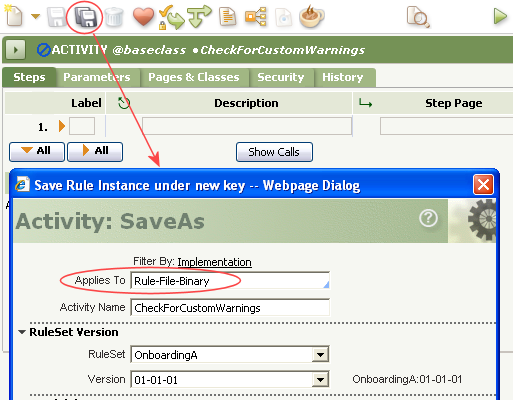
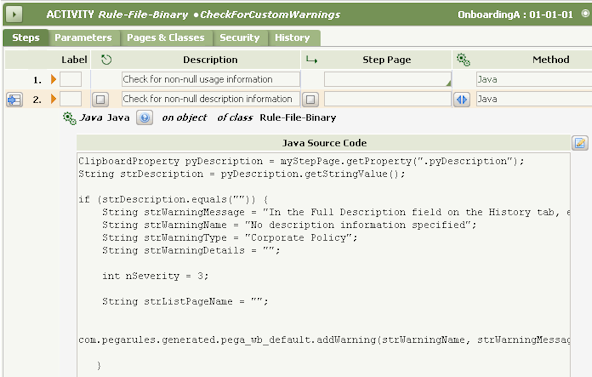
- Override the standard @baseclass.CheckForCustomWarnings activity in the class for which you want to provide additional warnings (for this example, the Rule-File-Binary class). This activity is expressly designed for adding custom warnings. To override the Rule-File-Binary.CheckForCustomWarnings activity, locate the rule and save a copy with the Applies To class set to Rule-File-Binary into one of your application's RuleSets.
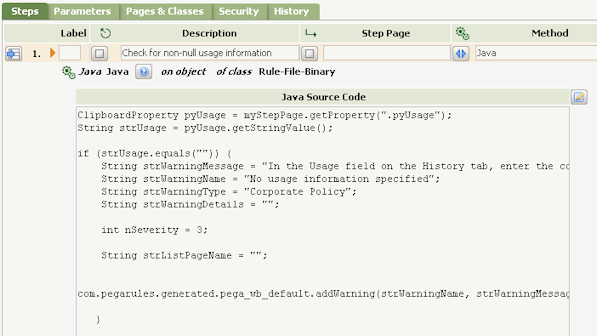
- In the CheckForCustomWarnings, add a step and specify
Javaas the method. Do not enter a step page, as the activity has the rule being saved (in this example, the binary file rule) as its primary page (the Applies To class). - In the Java Source Code of the step, specify the parameters for the call to the addWarningstandard function, and call the function.
In this example, the underlying property for the rule form's Usage field (pyUsage) is tested to see if it is
null. If it isnull(empty), the addWarning function is called with the appropriate parameters.ClipboardProperty pyUsage = myStepPage.getProperty(".pyUsage");
String strUsage = pyUsage.getStringValue();
if (strUsage.equals("")) {
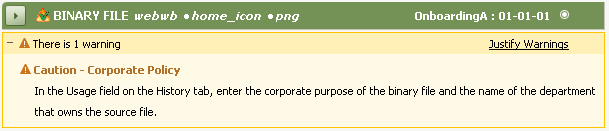
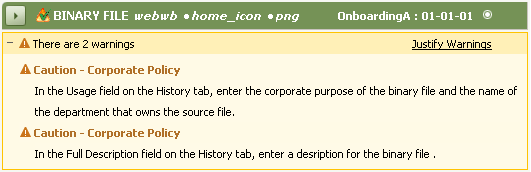
String strWarningMessage = "In the Usage field on the History tab, enter the corporate purpose of the binary file and the name of the department that owns the source file.";
String strWarningName = "No usage information specified";
String strWarningType = "Corporate Policy";
String strWarningDetails = "";
int nSeverity = 3;
String strListPageName = "";
com.pegarules.generated.pega_wb_default.addWarning(strWarningName, strWarningMessage, strWarningDetails, strWarningType, nSeverity, myStepPage, strListPageName);
}
- Save the CheckForCustomWarnings activity.
When a developer clicks the Save icon (![]() ) in a binary file rule in that application and the Usage field is empty, the custom rule warning is displayed:
) in a binary file rule in that application and the Usage field is empty, the custom rule warning is displayed:
To add an additional warning condition (for example, to check that the Full Description field is not empty) you can add a Java step to the activity for the test and call to addWarning for that condition.
When a developer saves a binary file rule without specifying both the Usage and Full Description fields, both warnings display on the rule form:
See How to create a rule warning for more details.
Final thoughts
Guardrails are guidance, not absolutes. Ideally, you make the revisions needed to remove the variance. However, making an exception might be appropriate for your particular organization in a specific situation. You have reasonable flexibility to respond to your business requirements — considering the needs of your users, your organization's maintainability needs, implementation risks, performance, and other factors. That said, in general, following the guardrails leads to PRPC applications that are well designed, straightforward to maintain, and architected to Build for Change™. They are your keys to successful application development.
Previous topic Ten Guardrails to Success Next topic Delivery Keys to Success