

         This documentation site is for previous versions. Visit our new documentation site for current releases.      
 

This content has been archived and is no longer being updated.

Links may not function; however, this content may be relevant to outdated versions of the product.

Display and export a chart by itself, without the report data

Updated on May 12, 2020

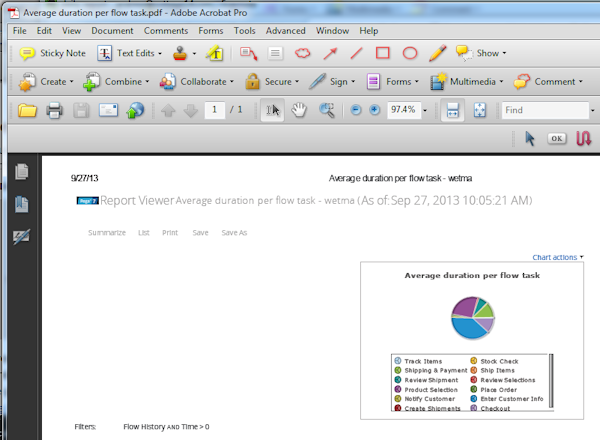
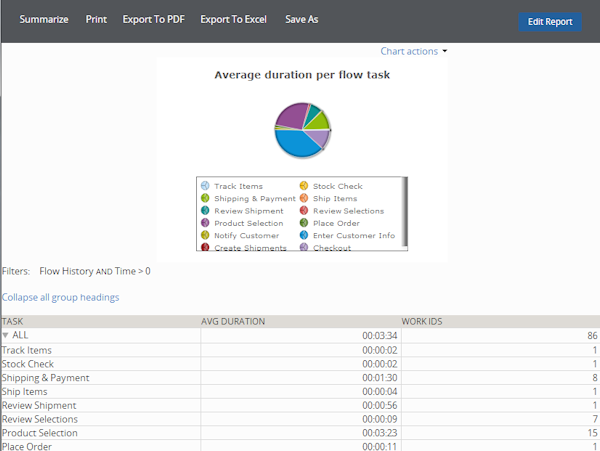
When you add a chart to a report, it typically displays above the report data, as in the example below:

chart and data

However, this default display may not suit your needs. In Pega 7, it is easy to have the chart display by itself.

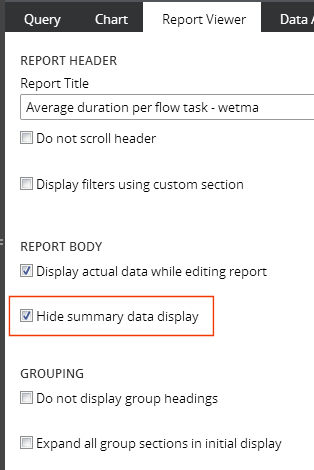
To display just the chart, open the Report Definition record for the report in question. On the Report Viewer tab, check the Hide summary data display checkbox:

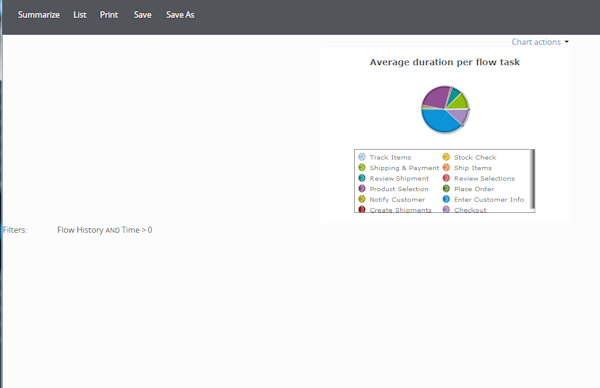
Save the record and run the report. Now the chart appears by itself:

chart only

To export the chart as a PDF, select Print from the toolbar, then choose the Print to PDF option. The chart appears in the resulting PDF without its supporting data, as in the image below:

chart as a PDF

Tags

Pega Platform 7.1.1 - 8.3.1 Reporting Financial Services Healthcare and Life Sciences Insurance Communications and Media Government Healthcare and Life Sciences Consumer Services Consumer Services Manufacturing Consumer Services

Have a question? Get answers now.

Visit the Support Center to ask questions, engage in discussions, share ideas, and help others.

Did you find this content helpful?

Want to help us improve this content?

We'd prefer it if you saw us at our best.

Pega.com is not optimized for Internet Explorer. For the optimal experience, please use:

Close Deprecation Notice
Contact us