How to use charts and reports in Pega Autonomic Event Services
The Reporting area in the AES Manager Portal provides access to a wide array of Pega® Autonomic Event Services-specific list reports, summary reports, and charts. These include:
- Enterprise and cluster-level alerts and exception reports
- Enterprise-level action item and exception item reports
- Enterprise-level charts showing requestor statistics
- Cluster/Application-level alert performance charts
- The Reporting area
- AES Cluster Reports
- AES Enterprise Reports
- AES Enterprise Charts
- Analyze Application Performance for Alerts
- Action Items by Status
Accessing the Reporting area
- On the Pega Autonomic Event Services welcome screen, enter your manager ID and password and click . Remember that passwords are case-sensitive.
- In the navigation panel, click the Reporting bar to open the work area as shown below:
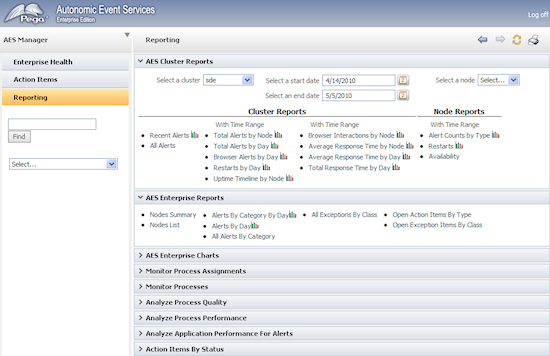
The Reporting navigational panel contains the following:
- Search bar — Search for a report by name
- A Report wizard drop-down list — Create custom version of a report using the Report wizard.

The Reporting area
The Reporting area includes these sections with Pega Autonomic Event Services-specific list and summary reports.
- AES Cluster Reports
- AES Enterprise Reports
- AES Enterprise Charts
- Analyze Application Performance for Alerts
- Action Items by Status
The other sections contain standard PRPC reports. For more information, see the PDN article Standard Monitor Activity Reports.
Using interactive graphs
This area contains interactive graphs that display statistical information. Use the following controls on the chat:
- Use the slider control to adjust the date range:

- Hover over a vertical line (date) to display an exact count.
- Click the
 icon to present the chart in a larger, full-screen window.
 - Click the
 icon to view the summary view output as numeric data.
To view and interact with the charts, your workstation web browser must include the Adobe Flash Player 9, a free download available at ![]() www.adobe.com/products/flashplayer.
www.adobe.com/products/flashplayer.
AES Cluster Reports
This section provides reports for clusters and the nodes that comprise them.
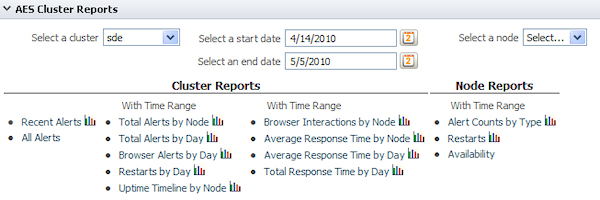
To access the reports:
- Select a cluster from the pull-down list.
- For Time Range reports, select a start and end date.
- For node reports, select a node from the pull-down list.
Cluster reports (no time range)
- Recent Alerts — Alerts received by Pega Autonomic Event Services for the selected cluster during the last ten minutes. The data is presented as a summary report and in a chart. Hover over a bar to display the numbers of alerts comprising the bar.
- All Alerts — Displays a list of alert types and counts for all the nodes within the cluster. The list is sorted by count. Click on a row to display the problem correlations for that alert type and the count of alerts associated with each problem.
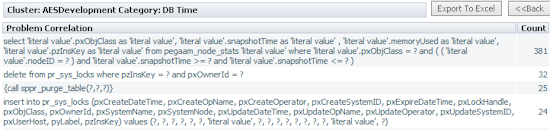
Click a row to display creation time, operator, and KPI threshold information about each of the alerts comprising the problem correlation.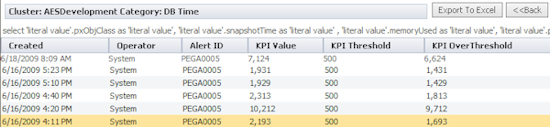
Click a row to open an alert item. This report is also available using the Alerts by Category option in the Action Items area.
Cluster reports with time range
The items included in these reports are defined by the start date and end dates you selected.
- Total Alerts by Node — Displays a chart and a list showing the alert count for each node in the cluster. Click a node name to open the list of alerts.
- Total Alerts by Day — Displays a chart and a list showing the daily count for all alerts. Click the cluster name to open the list of alerts.
- Browser Alerts by Day — Displays a chart and a list showing the daily count of PEGA0001 alerts for the cluster. Click the cluster name to open the list of alerts.
- Restarts by Day — Displays a chart and a list showing the daily count of PEGA0008 alerts. Click the cluster name to open the list of alerts.
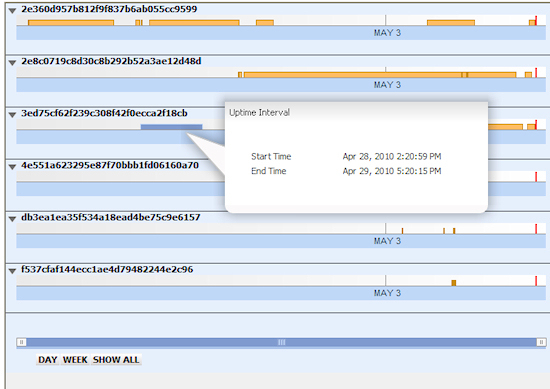
- Uptime Timeline by Node — Displays a bar chart showing the duration of uptime for each node in the cluster. The yellow bar indicates uptime. Hover over a bar to display the statistics. Use the , , and buttons to control the timeline within the defined date range.
- Browser Interactions by Node — Displays a chart and a list showing the total count of browser interactions for each node in the cluster.
The following reports display a chart and list or browser requestor times (in seconds). The charts use data retrieved from the monitored nodes as daily Log-Usage statistics. Network time is not included.
- Average Response Time by Node — Displays a chart showing, during the defined time range, the average times for each node in the cluster.
- Average Response Time by Day — Displays a chart showing the daily average times for the cluster.
- Total Response Time by Day — Displays a chart showing the daily cumulative times for the cluster.
Node reports with time range
The items included in these reports are defined by the start date and end dates, and by the node you select.
- Alert Counts by Type — Displays a chart and a list showing the count for each alert type. Click the alert type to open the list of alerts.
- Restarts — Displays a chart and a list showing the daily count of PEGA0008 alerts. Click the node name to open the list of alerts.
- Availability — Displays a list of time stamps indicating when the node started and when the last health message for that start time was received (beyond which the node was no longer available). The difference in times defines the duration of node uptime. The Uptime Timeline by Node cluster report provides the same information for all nodes in graphical format.
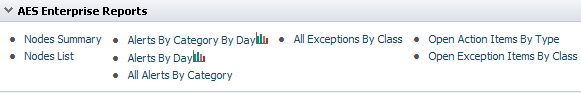
AES Enterprise Reports
This section provides the following reports:
- Nodes Summary — Displays a summary snapshot of the cluster's operational status including up time and counts for active requestors, agents, listeners, and database connection. To update the statistics, click the
 icon. This report is also available Enterprise Health work area on the Summary tab at cluster view
- Nodes List — Contains a list of Node Information data instances (PegaAES-Data-Nodes) that comprise the clusters across the enterprise.
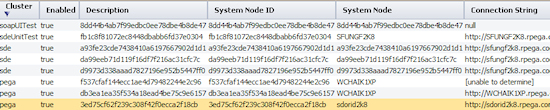
Click a node in the list to open its Node Information data instance form. You can use the form to enable or disable the node, or to modify the Description, Connection String, or Original Connection String values. - Alerts By Category By Day — Provides an interactive graph and list of counts for each alert category. The counts are grouped daily over the previous two weeks.
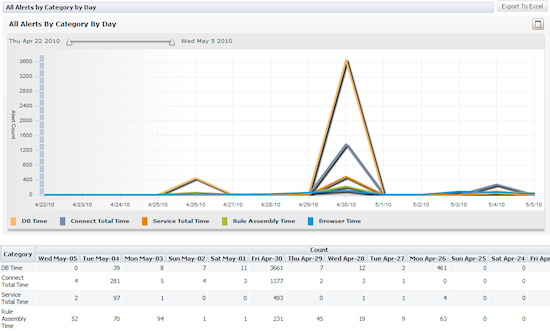
The graph updates automatically as of each system pulse.To display the daily statistics, hover over a graph line where it intersects with a vertical date line.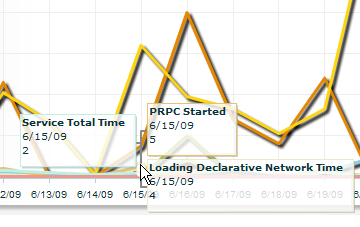
- Alerts By Day — Displays a chart and a list showing the daily count of alerts for all nodes across enterprise.
- All Alerts by Category — Provides counts of alerts in each category across the enterprise.
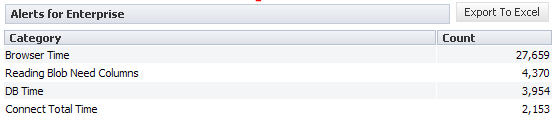
Click a category item to display a list and count of problem correlations in that alert category.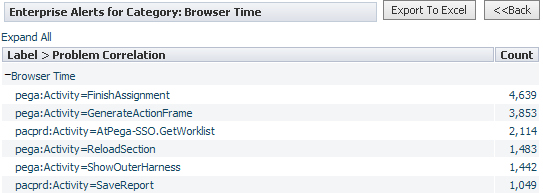
Click on a problem correlation item to display the list of alerts related to it.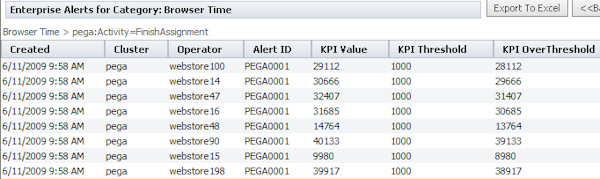
- All Exceptions By Class — Provides counts of all exceptions across the enterprise.
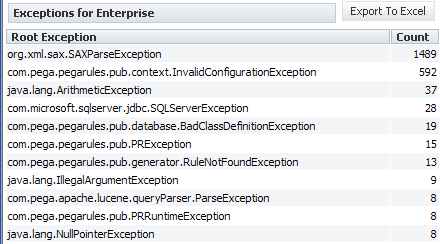
Click an exception item to display a list of problem correlations associated with that exception. Click an item to display the exception message.
- Open Action Items By Type — Provides counts of open (unresolved) action items organized by class type.

Click an item to display a list of items in the class.
Click a row to open the action item.
- Open Exception Items By Class — Provides counts of open (unresolved) exceptions organized by exception class:
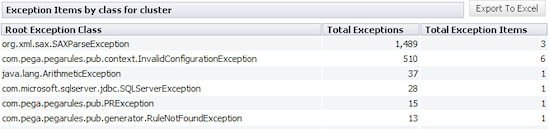
Click an item to display a list of items in the class.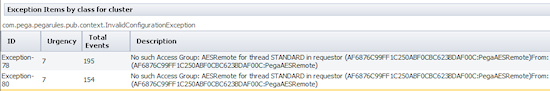
Click a row to open the exception item.
AES Enterprise Charts
This section displays a set of interactive charts that use requestor data collected during the prior two weeks from all nodes in the enterprise. You can create reports for an enterprise production level (set in the System data instance) or for all production levels.
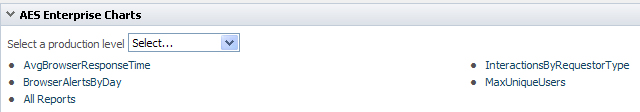
To open a chart, select a production level and click the report that you want to display:
- Enterprise Browser Average Response Time — The average processing time (in seconds) for browser requestors for a given date. The chart uses log usage data collected nightly from all nodes in the enterprise. This number does not include network time.

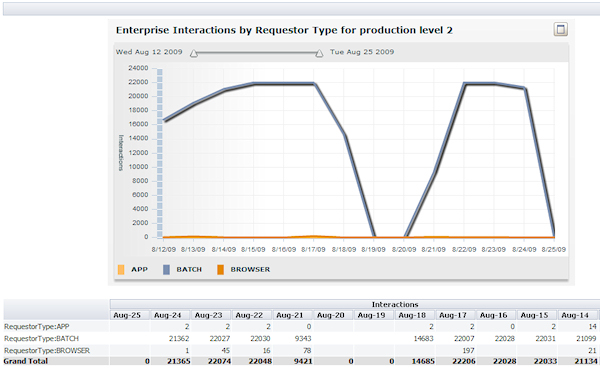
- Enterprise Interactions by Requestor Type — A count of application, batch, and browser interactions. The chart uses log usage data collected nightly from all nodes in the enterprise. Each requestor type is represented by a its own line.
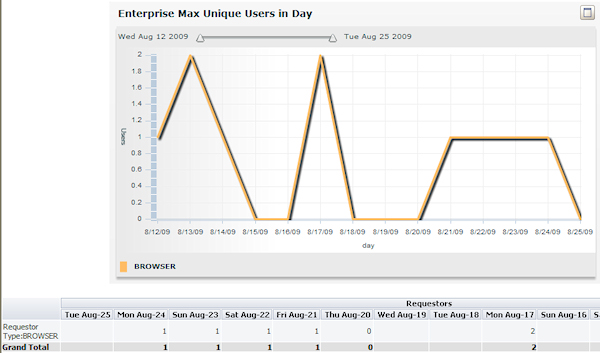
- Enterprise Max Unique Users in Day — A count of the maximum number of browser users. The chart uses log usage data collected nightly from all nodes in the enterprise.
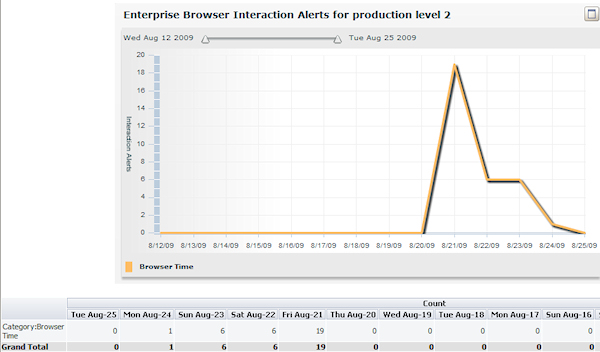
- Enterprise Browser Interaction Alerts — A count of browser interaction alerts (PEGA0001 - HTTP interaction time exceeds limit). The chart uses real-time alert data generated by all nodes in the enterprise. This data correlates to the Enterprise Browser Average Response Time chart shown above.
- All Reports — Displays the four Enterprise charts for all production levels.
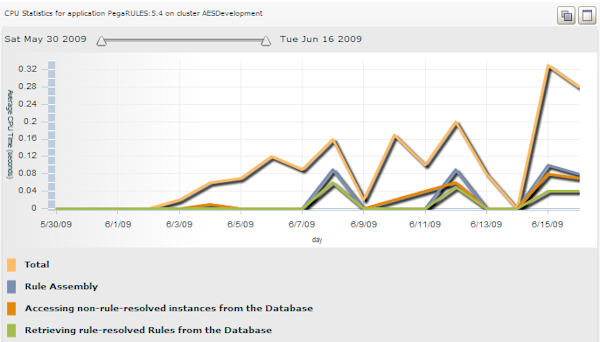
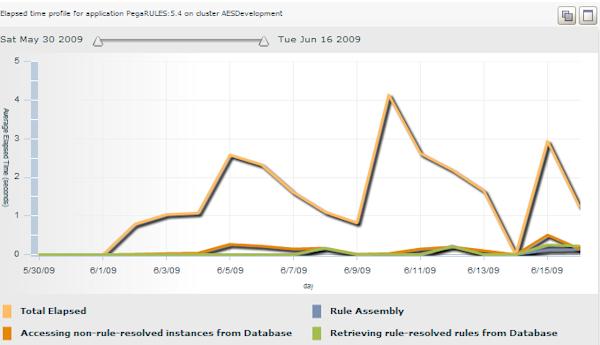
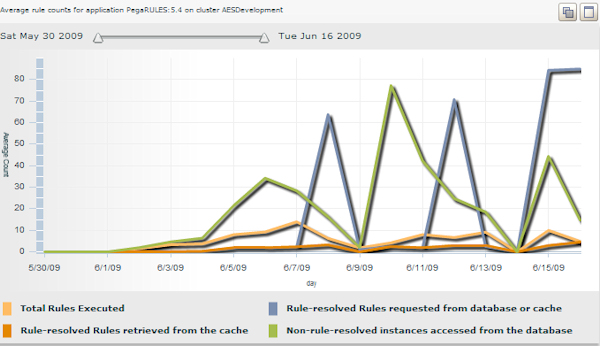
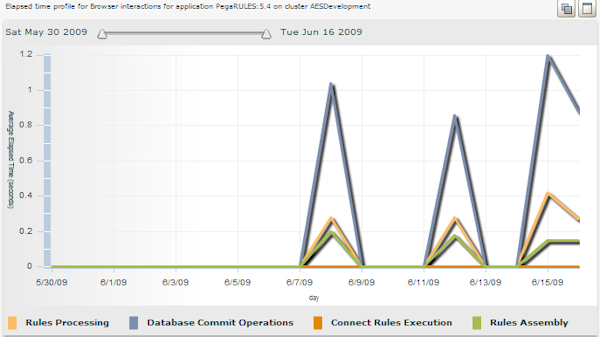
Analyze Application Performance for Alerts
This section enables you to produce interactive charts that profile system statistics in the cluster and application you select in the drop-down lists.
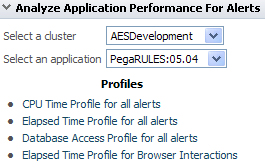
These charts correlate an application's performance to system changes over a span of two weeks.
- CPU Time Profile for all alerts
- Elapsed Time Profile for all alerts
- Database Access Profile for all alerts
- Elapses Time Profile for Browser Interactions
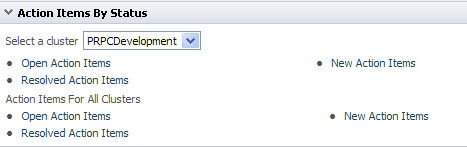
Action Items by Status
This section contains interactive charts that indicate the trend of alert counts for open, resolved, and new action items over a span of 15 days. To generate cluster reports, select one in the Select a cluster list and click the desired report. For enterprise-wide reports, make a selection in the Action Items For All Clusters group.
Previous topic How to use the Pega Autonomic Event Services Enterprise Health console