Dashboard widgets provided out of the box
Pega Sales Automation includes a set of standard dashboard widgets that capture your sales data to give you a real-time view of the state of your business.
Dashboard widgets for sales reps
As a sales representative, customize your dashboard by adding widgets to see the relevant data for your day-to-day operations.
- Attrition risk
- Tracks which areas of your organization require attention and how likely it is
that customers might leave for another company.
For more information, see Configuring the attrition risk widget.
- Closed + commit vs goal
- Provides insight into whether or not a sales rep’s closed business combined with
their commit deals will meet their quota for the quarter.
- The green area indicates closed deals for the current quarter.
- The gray area indicates committed deals.
- The quota trend line represents a sales rep quota.
- The On track with quota status is displayed when a sales rep’s committed deals are more than the quota.
- The At risk with quota status is displayed when a sales rep’s committed deals are less than the quota.
- Customer requests
- Tracks all open service requests that are associated with customers in the assigned organization.
- Internal quote summary (Pega Sales Automation for Insurance only)
- Summarizes the status and results of internal quotes for the last six months in a vertical bar chart. Quotes are summarized by product and status. The data table mode expands status categories to include the pending underwriter and underwriter decline statuses. The manager can filter by team member.
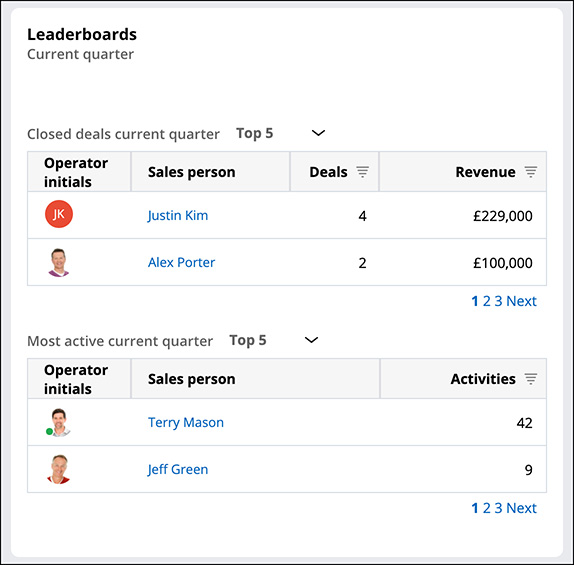
- Leaderboards
- Ranks sales team members based on their sales and activity performance in a gamification widget. You can compares deals, revenue and activities with colleagues reporting to the same manager for the current quarter.
- Leads by source
- Tracks leads by source for all leads that were created in the last 6 months. For example, you can see how many leads come from partners and how many from websites.
- Lead to opportunity conversion
- Tracks how many leads have been converted to opportunities by month over the last 6 months, with a conversion rate overlay.
- Monthly Sales and Renewals
- Shows won opportunities by sales type in a monthly stacked bar chart.
- Next best actions
- Lets you view the decisioning strategies to identify and rank next best actions for every opportunity set to close in the current quarter.
- Next best offers
- Guides sales reps to the top offers across their book of business by using artificial intelligence.
- Open leads by create date
- Tracks the leads assigned to sales reps created within the last 2 days. Leads created in last 0-3, and 4-8 days are considered as leads reviewed on time.
- Open opportunities without quote (Pega Sales Automation for Insurance only)
- Shows open opportunities with and without a quote in a vertical bar chart. The opportunities are categorized into proposal and past-proposal stages. The data table mode filters for opportunities without quotes and presents the opportunity amount totals. You can drill down to the opportunities list and open individual opportunities. The manager can filter by team member.
- Open tasks
- Tracks a sales rep’s open tasks, based on type and priority.
- Opportunities by competitor
- Tracks a sales rep’s open opportunities by competitor.
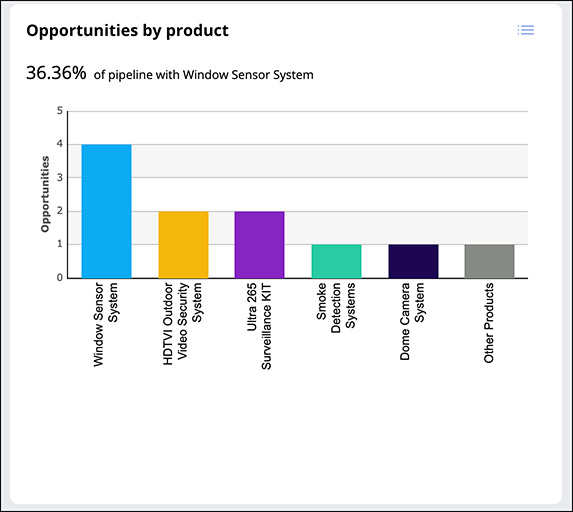
- Opportunities by product
- Tracks current open opportunities, broken down by the products being sold.
- Opportunity revenue by industry
- Tracks a sales rep’s opportunities by revenue industry for all won opportunities that are created in the current quarter and were created in the previous quarter.
- Pipeline
- Tracks a sales rep’s open opportunities by stage and amount.
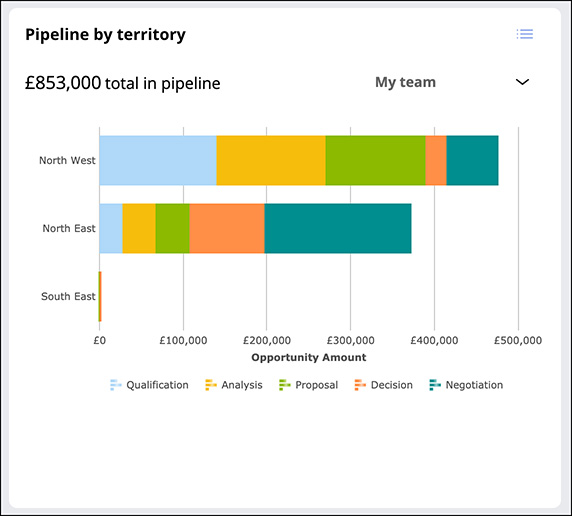
- Pipeline by territory
- Tracks the current pipeline, broken down by territory.
- Policy premium by product (Pega Sales Automation for Insurance only)
Shows policy premiums for policies that were created in the last 6 months by product in a vertical bar chart. The chart displays the top 5 products based on premium amounts, while the remaining products are consolidated and a single value is displayed. In data table mode, you can drill down to the policies list and open individual policies. The manager can filter by team member.
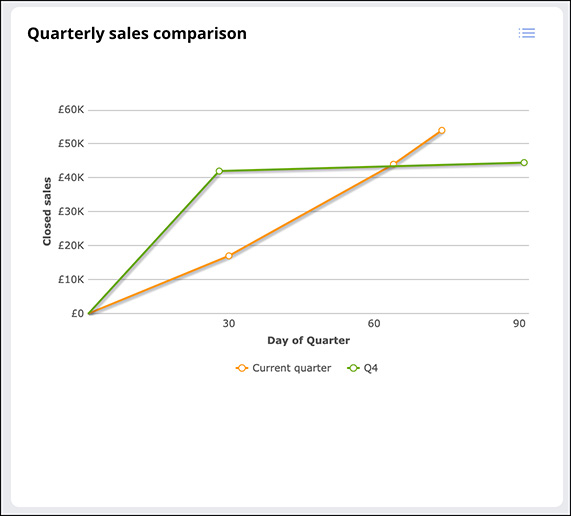
- Quarterly sales comparison
- Shows a sales rep’s quarter over quarter comparison of closed sales. Each line represents closed deals for a particular quarter.
- Quota attainment
- Tracks a sales rep’s quarter to date sales as a percentage of quota.
- Quote count by competitor and product (Pega Sales Automation for Insurance only)
Shows external quote count by competitor and product in a vertical bar chart. Quotes for the last six months and up to four top competitors are presented. The manager can filter by team member.
- Sales Futurecast
- Provides artificial intelligence-based insight into whether or not a sales rep
is going to meet their quota for the quarter.
- The green area indicates closed deals for the current quarter.
- The yellow area shows open deals with predictive weighted-win probability.
- The trend line represents a sales rep's quota.
- The On track with quota status is displayed when the cumulative sum of open predictive deals for a sales rep is more than the quota.
- The At risk with quota status is displayed when the cumulative sum of open predictive deals for a sales rep is less than the quota.
- Successful referrals
- Tracks all referral leads that are opened by a sales rep and are managed by other representatives.
- Top 5 expiring contracts
- Displays top 5 highest amount opportunities with contract end dates in the next 6 months from today.
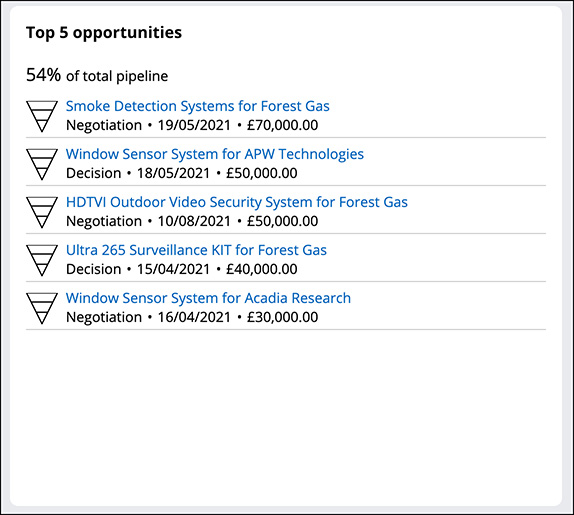
- Top 5 opportunities
- Tracks the top 5 opportunities that are in the final two stages of the sales process by dollar amount .
- Top 5 sales priorities (Pega Sales Automation for Insurance only)
Lists the top 5 policy renewal and open sales opportunities by amount for the applicable territory.
- Underwriter activity (Pega Sales Automation for Insurance only)
- Shows a leaderboard that tracks performance from an underwriting perspective. Helps you to monitor the use of the underwriting resources and relationships that are integral to the success of your sales team.
- Sales reps are ranked based on opportunity and quoting data for the last six months.
- You can select the data display for the top 5 and bottom 5 sales reps.
- Shows the underwriter (UW) score of the underwriter's peers (encrypted names) who report to the same manager.
- You can run and export a report that shows a complete summary of underwriter activities.
- Upcoming birthdays
- Shows upcoming birthdays for contacts in a sales rep’s territory with email and mobile call capabilities.
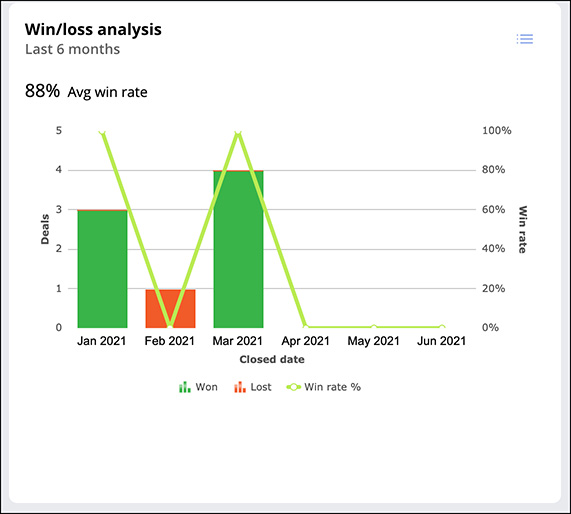
- Win / Loss analysis
- Tracks won and lost opportunities by month with a win rate overlay in a stacked bar chart. In Pega Sales Automation for Insurance, you can select the data display for all opportunities versus renewals.
Dashboard widgets for sales managers
As a sales manager, customize your dashboard by adding widgets to see relevant data about your team's performance.
- Activity map for sales team
- Tracks a sales team's customer engagement activity.
- Attrition risk
- Tracks which areas of your organization require attention and how likely it is
that customers may leave for another company.
For more information, see Configuring the attrition risk widget.
- Campaign success summary of sales team
- Tracks the campaign effectiveness of a sales manager's team members through the number of leads converted to opportunities.
- Closed + Commit vs Goal of Sales Team
- Provides insight into a sales manager’s team's closed business, combined with
their committed deals for the current quarter.
- The green area indicates closed deals for the current quarter.
- The grey area indicates committed deals.
- The trend line represents the sales manager's quota.
- The On track with quota status is displayed when a team’s committed deals are more than the manager’s quota.
- The At risk with quota status is displayed when a team’s committed deals are less than the manager’s quota.
- Completed activities by sales rep
- Tracks the top 10 most active members of a sales manager’s team and provides insight into the last 30 days of activities, by communication type.
- Customer requests of sales team
- Tracks all open service requests associated with customers in their assigned organizations for customer service rep’s in a sales manager's team.
- Email sentiment by organization
- Tracks the sentiment of email engagements in the context of an organization. Classifies the tone of email text, exchanged with prospect or client as positive, negative, or neutral.
- The insight is based on the last six months of data. You can open particular emails by switching to list view and selecting an email from the list.
- Email sentiment by sales representative
- Tracks the sentiment of email engagements in the context of the whole team, where each sales rep is represented in the bar chart. Classifies the tone of email text, exchanged with prospect or client as positive, negative, or neutral.
- The insight is based on the last six months of data. You can open particular emails by switching to list view and selecting an email from the list.
- Internal quote summary (Pega Sales Automation for Insurance only)
- Summarizes the status and results of internal quotes for the last six months in a vertical bar chart. Quotes are summarized by product and status. The data table mode expands status categories to include the pending underwriter and underwriter decline statuses. The manager can filter by team member.
- Lead by source of sales team
- Tracks sales manager’s team leads created in the last 6 months by source.
- Leaderboards
- Ranks sales manager’s team members based on sales and activity performance in a tabular gamification widget. The manager can drill-down on sales persons to view their deals.
- Lead to opportunity conversions of sales team
- Tracks a sales team's leads converted to opportunity by month, with a conversion rate overlay.
- Next best actions
- Identifies and ranks, through decisioning strategies, the sales manager’s next best actions for every opportunity set to close in the current quarter.
- Open leads by create data of sales team
- Tracks leads that were created within the last 2 days and assigned to sales teams. Leads created in the last 0-3 and 4-8 days are considered as leads reviewed on time. The widget also shows leads created in the last 0-28 days that require review.
- Open opportunities without quote (Pega Sales Automation for Insurance only)
- Shows open opportunities with and without a quote in a vertical bar chart. The opportunities are categorized into proposal and past-proposal stages. The data table mode filters for opportunities without quotes and presents the opportunity amount totals. You can drill down to the opportunities list and open individual opportunities. The manager can filter by team member.
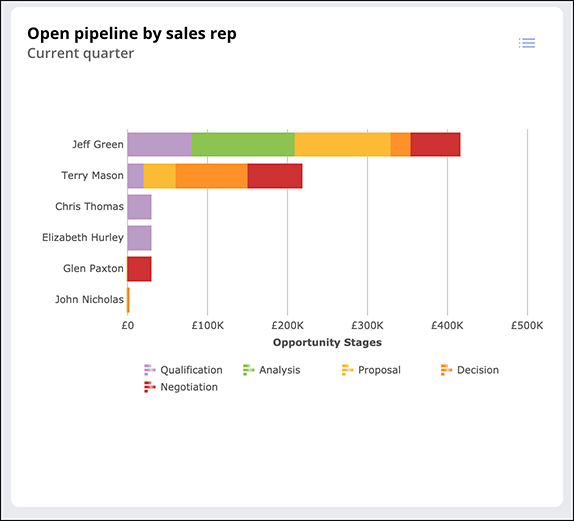
- Open pipeline by sales rep
- Tracks the pipeline of the top 10 of the sales manager’s team. Provides insight into the team’s pipeline by opportunity stages for the current quarter.
- Open tasks of sales team
- Tracks a sales manager’s team members' open tasks, based on type and priority.
- Opportunities by competitor of sales team
- Tracks a sales manager’s team's open opportunities by competitor.
- Opportunities by product of sales team
- Tracks a sales manager’s team members' current open opportunities, broken down by the products being sold.
- Opportunity revenue by industry of sales team
- Tracks a sales rep’s opportunities by revenue industry for all won opportunities created in the current and previous quarter.
- Pipeline by territory for sales team
- Tracks a sales manager’s team members' current pipeline, broken down by territory.
- Pipeline for visibility into sales rep’s open opportunities
- Tracks a sales rep’s open opportunities by stage and amount.
- Policy premium by product (Pega Sales Automation for Insurance only)
Shows policy premiums for policies that were created in the last 6 months by product in a vertical bar chart. The chart displays the top 5 products based on premium amounts, while the remaining products are consolidated and a single value is displayed. In data table mode, you can drill down to the policies list and open individual policies. The manager can filter by team member.
- Quarterly sales comparison for visibility into sales team’s closed deals
- Provides insight into a sales manager’s team's quarter-on-quarter comparison of closed sales. Each line represents closed deals for a particular quarter.
- Quota attainment for visibility into sales team quarter to date sales
- Tracks a sales manager’s team's quarter to date sales as a percentage of quota.
- Quote count by competitor and product (Pega Sales Automation for Insurance only)
Shows external quote count by competitor and product in a vertical bar chart. Quotes for the last six months and up to four top competitors are presented. The manager can filter by team member.
- Sales coach for sales team
- Provides artificial intelligence-based insight into coaching actions for the
sales team.
- Tracks a sales rep’s future actions to be taken.
- Shows suggestions to sales representatives about how to improve their performance.
- The manager can view additional information and a list of knowledge articles associated with that information.
- Sales futurecast for visibility into sales rep’s quota prediction
- Provides an artificial intelligence-based insight into whether a sales manager’s
team is going to attain quota for the quarter.
- The green area indicates closed deals for the current quarter.
- The yellow area indicates open deals with predictive weighted win probability.
- The trend line represent sales manager quota.
- The On track with quota status is displayed when the cumulative sum of open predictive deals for a team is more than the manager’s quota.
- The At risk with quota status is displayed when the cumulative sum of open predictive deals for a team is less than the managers quota.
- Sales manager coach
- Provides artificial intelligence-based insight into effectiveness of sales
representatives based on the number of created contacts, converted leads, and
the opportunity pipeline.
- The adaptive models capture all of these actions, to predict the effectiveness of the corresponding sales representatives.
- Radar charts provide precise insights about the adaptive models.
- Sales tracker by sales rep
- Tracks a sales manager’s team members' closed deals against quota, with the percentage of attainment.
- Successful referrals of sales team
- Tracks all referral leads opened by a sales manager that are managed by other representatives.
- Top 5 opportunities of sales team
- Tracks a sales team's members' top 5 opportunities by dollar amount that are in the final two stages of the sales process.
- Top 5 sales priorities (Pega Sales Automation for Insurance only)
Lists the top 5 policy renewal and open sales opportunities by amount, for the applicable territory.
- Trending topics by organization
- Tracks the trending topics for each organization. Classifies the underlying intent of inquiries from prospects or customers.
- The insight is based on the last six months of data. You can open the emails that a topic is derived from. To do this, switch to list view and expand the particular topic.
- Trending topics by sales rep
- Tracks the trending topics for each sales rep. The insight is based on the last six months of data.
- You can open the emails that a topic is derived from. To do this, switch to list view and expand the particular topic.
- Underwriter activity (Pega Sales Automation for Insurance only)
- Shows a leaderboard that tracks performance from an underwriting perspective. Helps you monitor the use of the underwriting resources and relationships that are integral to the success of your sales team.
- Sales reps are ranked based on opportunity and quoting data for the last six months.
- You can select the data display for the top 5 and bottom 5 sales reps.
- You can see the UW score of their direct reports and include territory data to see the UW score of the sales reps in their territory, including all direct reports and other sales persons (encrypted names) in the territory.
- You can run and export a report that shows a complete summary of underwriter activities.
- Upcoming birthdays under sales manager's territory
- Shows birthdays for contacts in a sales manager's territory, with email and mobile call capabilities.
- Win/Loss analysis for sales team
- Shows won and lost opportunities by month, with a win rate overlay in a stacked bar chart. You can filter by team member. Tracks sales team won and lost opportunities in the last 6 months with a win rate overlay. In Pega Sales Automation for Insurance, you can select the data display for all opportunities versus renewals.
Dashboard widgets for sales ops
As a sales ops, customize your dashboard by adding widgets to see the relevant data for your day-to-day operations.
- Leaderboards
- Ranks sales ops team members based on sales and activity performance in a tabular gamification widget. Sales ops users can drill-down on sales persons to view the deals that they make.
- My pipeline
- Tracks a sales rep’s open opportunities by stage and amount.
- Win / Loss analysis
- Tracks won and lost opportunities by month with a win rate overlay in a stacked bar chart. In Pega Sales Automation for Insurance, you can select the data display for all opportunities versus renewals.

Organization dashboard widgets
Each organization has its own dashboard with insight widgets. In the User Portal, go to the Organizations landing page, select an organization, and then go to Dashboard.
- Activities by communication type
- Tracks all the activities related to the organization under different communication types in the last 6 months, and displays them as a bar chart.
- Open service requests
- Displays a list of all customer service requests related to the contacts of the organization based on input from Pega Customer Service.
- Sentiment trend
- Shows the sentiment trend of email engagements of that organization. Classifies the tone of email text as positive, negative, or neutral.
- Service requests by urgency
- Displays a bar chart of the service items relative to their urgency based on input from Pega Customer Service.
- Trending topics
- Tracks the trending topics for the organization.

Previous topic Personalizing dashboards by managing widgets Next topic Configuring the attrition risk widget