Support Play: Tuning the IBM JVM 5.0 for performance
Summary
As a Java application, Process Commander runs in the Java Virtual Memory (JVM). A Java application allocates all its objects in the memory heap which is managed by the Garbage Collector. To maximize the efficiency of an application running in a JVM, it is important to tune the memory allocation and garbage collection functions of the JVM.
Process Commander is supported by both popular JVMs: the Sun JVM and the IBM JVM. This Support Play describes tuning that you can perform for IBM JVM 5.0, along with some example error messages that point to areas which could benefit from this tuning.
Quick Links
Concurrent Mark Sweep Collector
- Mark
- Parallel Mark
- Concurrent Mark
- Sweep
- Concurrent Sweep
- Compaction
How to View Garbage Collection Statistics
Viewing verboseGC from the log
- Nursery Allocation Failure Output
- Tenured Allocation Failure Output
- Allocation Failure during Concurrent Mark output
Viewing verboseGC from Process Commander Monitoring tools
- Garbage Collection Statistics
- Log Usage Statistics
Troubleshooting an Out of Memory Error
Suggested Approach
IBM has published the IBM Developer Kit and Runtime Environment Java 2 Technology Edition Version 5.0 Diagnostics Guide (Fifth Edition, January 2007). This book is available as a PDF file at ![]() http://www-128.ibm.com/developerworks/java/jdk/diagnosis/index.html
http://www-128.ibm.com/developerworks/java/jdk/diagnosis/index.html
Background
The IBM Java Virtual Machine (JVM) allocates space for applications to run in virtual memory. This space is known as the heap. On initialization, the JVM allocates the entire heap in a single contiguous area of virtual storage; the amount of memory that is allocated is determined by the setting of the –Xmx parameter (details on this setting appear below). Within that limit, the heap may expand or contract, depending on the space required for various objects. (Specifics on precisely when the heap expands or contracts are outside the scope of this article, but are described in the IBM Diagnostic Guide.) For the purposes of this Support Play, it is sufficient to know that the heap will handle this resizing efficiently if the application is well written.
Each time a Java application uses a Java object, memory space for that object is allocated from the heap. Depending on the object’s size, and how long it will remain live, space will be allocated in a different part of the heap; similar object allocations are grouped together for performance optimization.
Objects in Java are allocated space in the heap wherever there is enough contiguous space. Like data being stored on a PC’s hard drive, the heap space becomes fragmented over time. For example, the heap may contain enough space to open a 640KB object. However, this space is broken up into 128K chunks, so the space is not contiguous and cannot be used for this object. Unlike a PC, which can store one large file in several locations, the space for Java object allocations must be together.
Thus, the heap has a space for small objects called the Small Object Area (SOA), where many small objects will be stored, deleted, and new ones stored again. If there is not enough allocated space in the SOA, and the object is 64K or larger, the object is allocated in the Large Object Area (LOA). For example, the Process Commander caches are generally allocated in the LOA. Depending on the usage of these areas (the number of small objects vs. large objects), the heap will automatically shrink or expand these areas as needed, using the following algorithms:
If an allocation failure occurs in the SOA:
- If the current size of the LOA is larger than its initial size, and the amount of free space in the LOA is greater than 70%, reduce the percentage of space that is allocated to the LOA by 1%.
- If the current size of the LOA is equal to or less than its initial size, and the amount of free space in the LOA is greater than 90%:
- Reduce the percentage of space allocated to the LOA by 1% if the current size of the LOA is greater than 1% of the heap.
- Reduce the percentage of space allocated to the LOA by 0.1% if the current size of the LOA is 1% or less of the heap.
If an allocation failure occurs in the LOA, increase the LOA by 1% if:
- the size of the allocation request is greater than 20% of the current size of the LOA.
- the current size of the LOA is less than its initial size and the amount of free space in the LOA is less than 50%.
- the current size of the LOA is equal to or greater than its initial size and if the amount of free space in the LOA is less than 30%.
JVM Parameters
There are many parameters available for the IBM JVM that allow customization of each system. The parameters detailed in this section are the ones that we recommend adjusting when using Process Commander; other parameters may also be adjusted at the discretion of the customer’s Java administrator.
- -Xms<size> Sets the initial size of the heap.
- -Xmx<size> Sets the maximum size of the heap.
The Java heap size is one of the most important tunable parameters of your JVM. It is especially important if several processes and JVMs are being run on your system. The heap contains all Java objects (live and discarded), along with free memory.
Some manuals recommend setting –Xmx and –Xms to the same value. However, using the same values is not generally a good idea; since garbage collection is based on how full your heap is, a large minimum value will delay the start of garbage collection until the heap is full. In addition, the first time the Garbage Collector runs on a full heap, it will take a long time and become a very expensive operation. Also, a larger heap is most likely to be fragmented, leading to the need to do a heap compaction - again, a very expensive operation.
The recommendation is to start your application with the minimum heap size that it needs. When the application starts up, the Garbage Collector will run often and, because the heap is small, efficiently. The heap will then expand based on an application’s allocation requests until it reaches the value specified by –Xmx. Expansion occurs after garbage collection if GC is unable to free enough heap storage for an allocation request, or if the JVM determines that expanding the heap is required for better performance.
What you consider to be an acceptable heap size depends on your application; you will need to experiment. In addition to balancing the frequency and length of garbage collections, remember that memory that is allocated to one application’s heap is not available to other applications. This is an example of fixing a bottleneck in one area, by increasing heap size to decrease frequency of garbage collection, and causing problems somewhere else. For example, other processes might require paging to supplement their diminished memory. Under no circumstances should heap size be larger than physical memory.
Examples of the use of -Xms and -Xmx are:
-Xms2m -Xmx64m: Heap starts at 2 MB and grows to a maximum of 64 MB.
-Xms100m X mx100m: Heap starts at 100MB and can never grow.
-Xms20m -Xmx1024m: Heap starts at 20MB and grow to a maximum of 1GB.
- Xms50m: Heap starts at 50MB and grows to the default maximum.
-Xmx256m: Heap starts at default initial value and grows to a maximum of 256MB.
NOTE: When entering the -Xmx and -Xms information, make sure to use a lowercase "m" after the number: -Xms100m. If you use an upper-case M, Java will not read it and will throw out-of-memory errors.
Garbage Collection
As noted earlier, objects are allocated space in the heap, used, and then discarded. An object continues to be live while a reference to it exists somewhere in the system; when an object ceases to be referenced, it becomes garbage. Rather than keeping all the discarded objects in the heap (which would eventually take up all the space in the system), the Garbage Collector runs and removes the objects from allocation, freeing up memory.
The IBM Garbage Collector is a stop-the-world operation. That means that all application threads are stopped while the garbage is collected and no user processing is accomplished. Therefore, it is important that garbage collections be as efficient as possible.
A high-level overview of the garbage collection process is as follows:
- The application instantiates a new Java object and allocates it in the heap.
- Not enough contiguous space exists in the heap for this object, so there is an allocation failure (memory allocation fault).
NOTE: This failure does not, at this point, display an error to the user. It is only visible in the GC log if verboseGC is enabled. - The allocation failure triggers a garbage collection. The Garbage Collector collects and discards all the garbage in the heap that it can, freeing up allocation space.
- The allocation for the new Java object is retried.
There are two types of Garbage Collection:
- Concurrent Mark Sweep or Global (default)
- Generational Concurrent
Concurrent Mark Sweep Collector
This garbage collector is the default collector and consists of the following phases:
- Mark
- Sweep
- Concurrent Sweep
- Compaction (optional)
NOTE: You can also create an explicit call to the Garbage Collector by using the System.gc() call. However, both Pegasystems and IBM recommend that this call NOT be used. The Garbage Collector is carefully tuned to deliver maximum performance to the JVM; forcing it to run with an explicit call during processing will severely degrade the JVM performance.
Mark
In the mark phase, all the objects that are referenced in the system are identified and scanned for other references that they make. This identifies all the live objects, as well as the objects which are no longer referenced. Marking is a fairly expensive operation in terms of system resources.
Parallel Mark
The majority of garbage collection time is spent marking objects. Therefore, a parallel version of mark has been developed. Parallel Mark does not degrade mark performance on a uniprocessor and increases typical mark performance on a multiprocessor system.
Rather than just using one thread for the Mark phase, Parallel Mark uses one application thread and multiple helper threads. Parallel Mark is most useful on a multiprocessor system; a platform with N processors will have N-1 helper threads created by default. It is possible to change the number of helper threads, but N-1 is optimal and should not be changed for most systems. More marking will be accomplished in less time, which results in performance improvements as the marking is being done in the background, rather than in the stop-the-world mark phase.
For multiple-CPU systems, Parallel Mark is enabled by default; this setting can also be used in conjunction with Concurrent Mark (see the next section).
Concurrent Mark
Concurrent Mark reduces garbage collection times by starting a marking phase before the heap is full. Marking unreferenced items as garbage is done in the background, so that when an allocation failure occurs and garbage must be collected, only the much quicker sweep phase must be run, and the other threads are stopped for a much shorter time. The Garbage Collector starts the concurrent mark phase so that it finishes at the same time that the heap is exhausted. This is accomplished by the Garbage Collector constantly tuning the parameters that control Concurrent Mark.
Note that although this processing is done in the background, it still will require some CPU. The overhead varies depending upon how much idle CPU time is available for the background thread.
By default, Concurrent Mark is disabled. To enable Concurrent Mark, use the following parameter:
-Xgcpolicy:optavgpause
Sweep
In this phase, the system collects all the unreferenced objects as garbage, freeing up the space they were allocated. Sweeps are very quick and do not require a lot of system resources.
Concurrent Sweep
Like Concurrent Mark, Concurrent Sweep provides reduced Garbage Collection pause times as the heap size increases. Concurrent Sweep begins as soon as a stop-the-world collection ends. The Concurrent Sweep consists of the following processes:
- Sweep Analysis – analyzes sections of data and determines ranges of free or potentially free memory.
- Connection – analyzes sections of the heap and connects them into the free memory area.
Concurrent Sweep runs in conjunction with Concurrent Mark; enable it with the same parameter:
-Xgcpolicy:optavgpause
Compaction
As stated above, a garbage collection is triggered by the system trying and failing to allocate heap space to a Java object. After the system marks all the objects and does a sweep to free up space, the allocation is attempted again. If the space in the heap is very fragmented and there is still not enough contiguous space to allocate the object, then a compaction occurs. This is similar to a defragmentation of a PC drive in that all the referenced objects in the heap space are compacted together, freeing up more contiguous space. Compaction rarely occurs and requires a lot of system resources.
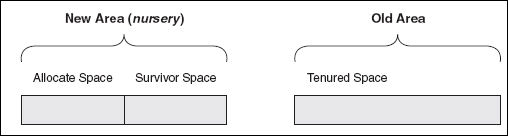
Generational Concurrent Garbage Collector
Use the Generational Concurrent Garbage Collector if your application creates many short-lived objects. The Generational Collector splits the heap into two sections:
New Area (Nursery) – this section is split into two areas called Allocate and Survivor.
Old Area (Tenured) – contains long-lived objects that have survived a specified number of garbage collections.
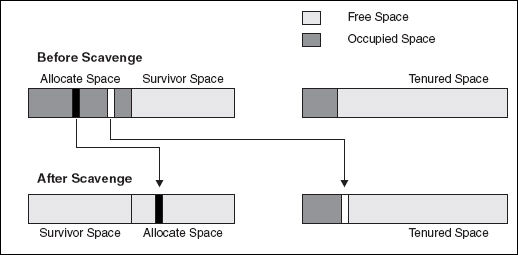
During a Generational Concurrent collection, objects are stored in the Allocate space. When this area fills up, a Garbage Collection process called a Scavenge is initiated. This process copies live objects to either the Survivor space or the Tenured space.
Objects of a specific Tenured age are moved to the Tenured Space. This number is determined by the JVM and is adjusted based on percentage of space used in the Nursery. The age when an object can be moved to the Tenured space reaches a maximum value of 14. That is, if an object survived 14 garbage collections, it gets moved to the Tenured space.
After the live objects are moved to the Survivor or Tenured space, the unreferenced objects are removed from the Allocate Space. Then the two Nursery spaces switch roles; the Allocate space becomes the Survivor space and the Survivor space becomes the Allocate space. The new Survivor space is empty and ready for copying of live objects from the new Allocated space during the next Scavenge.
How to View Garbage Collection Statistics
When tuning a JVM, begin by using the verboseGC setting to create a garbage collection log file, known as the verboseGC log or verboseGC file.
IMPORTANT: VerboseGC logging overhead is small, so enabling this switch in any environment is strongly recommended.
Here are three verboseGC settings you can use:
- -verbosegc, -verbose:gc Prints garbage collection information. The format for the generated information is not architected and therefore varies from platform to platform and release to release.
- -Xverbosegclog:<path to file><filename> Causes verboseGC output to be written to the specified file. If the file cannot be found, verboseGC tries to create the file, and then continues as normal if it is successful. If it cannot create the file, for example, if an invalid filename is passed into the command, it will redirect the output to stderr.
- Xverbosegclog:<path to file><filename, X, Y> X and Y are integers. This option works similarly to -Xverbosegclog:<path to file><filename>, but, in addition, the verboseGC output is redirected to X number files, each containing verboseGC output from Y number of GC cycles.
Enable these settings in the Java command line. For Process Commander, that generally involves using the application server Administrative Console (for WebSphere or WebLogic) or editing the setenv file (for Tomcat).
Once the setting is enabled, the verboseGC log file will be created. The default name begins with native_stderr and ends with .log; custom file names may be used by setting Xverbosegclog. Again, the location of this file will vary according to the application server. For example, the WebSphere Diagnostic Data paper says the following:
“Native code running in a WebSphere Application Server process can write data to the process logs (also called native logs). Native code is non-Java code, typically found in files with .dll, .exe, and .so extensions. The process logs are named native_stdout.log and native_stderr.log. They are located in the <WAS_install_root>/profiles/<profile>/logs/<server> directory.”
Sadtler, Carla, and David Titzler: WebSphere Application Server V6: Diagnostic Data. IBM Redbooks Paper, 2005, p. 12.
Viewing verboseGC from the log
When an allocation failure occurs, the output produced depends on the area of the heap in which the failure occurred. This section shows allocation failure output generated from different areas of the heap. Below is a generic sample of output from a verboseGC log:
<gc type="global" id="5" totalid="5" intervalms="18.880">
<compaction movecount="9282" movebytes="508064" reason="forced compaction" />
<expansion type="tenured" amount="1048576" newsize="3145728" timetaken="0.011"
reason="insufficient free space following gc" />
<refs_cleared soft="0" weak="0" phantom="0" />
<finalization objectsqueued="0" />
<timesms mark="7.544" sweep="0.088" compact="9.992" total="17.737" />
<tenured freebytes="1567256" totalbytes="3145728" percent="49" >
<soa freebytes="1441816" totalbytes="3020288" percent="47" />
<loa freebytes="125440" totalbytes="125440" percent="100" />
</tenured>
</gc>
where:
gc type= indicates the type of garbage collection triggered. In this case, “global” indicates a global garbage collection (Concurrent Mark Sweep).
id= is the occurrence number of this garbage collection, for example this is the fifth (id=5) Global GC.
totalid= is the total number of all types of garbage collections that have taken place. In the above example the totalid is the same as the id, so all of the garbage collections that have occurred are global GCs.
intervalms= is the number of milliseconds since the last Global collection,
compaction – This line appears if you specified -Xcompactc on the command line and shows:
movecount - the number of objects moved during compaction
movebytes - the total number of bytes these objects represented
reason - the reason for the compaction. In this example it was forced compaction.expansion indicates that after the garbage collection the heap was expanded. This section displays:
- type - the area expanded (“tenured”)
- amount - the amount (in bytes) the area was expanded
newsize - the new size of the area - timetaken - how long the expansion took, in milliseconds
- reason – the reason for the expansion, in this example it was “insufficient free space following gc”.
refs_cleared indicates the number of Java objects cleared:
soft – collected if their referent (pointer) has not been marked for the previous 32 collection cycles.
weak and phanthom – always collected if their referent is not marked.finalization details the number of objects that contain finalizers that were queued up by the VM for finalization during collection.
timems indicates the time taken for each of the phases; mark, sweep, and compact. It also includes the total time for the collection.
tenured, soa, and loa indicate the status of these areas after the collection, as follows:
freebytes – the number of bytes free after the collection
totalbytes – the total number of bytes in the heap
percentage – the percentage of free bytes in the heap
Nursery Allocation Failure Output
The following is a sample of verboseGC output for an allocation failure in the Nursery area of the heap:
<af type=”nursery” id=”28” timestamp=”Fri Jul 15 13:11:45 2005” intervalms=”65.0 16”>
<minimum requested_bytes=”520” />
<time exclusiveaccessms=”0.018” />
<nursery freebytes=”0” totalbytes=”8239104” percent=”0” />
<tenured freebytes=”5965800” totalbytes=”21635584” percent=”27” >
<soa freebytes=”4884456” totalbytes=”20554240” percent=”23” />
<loa freebytes=”1081344” totalbytes=”1081344” percent=”100” />
</tenured>
<gc type=”scavenger” id=”28” otaled=”30” intervalms=”65.079”>
<expansion type=”nursery” amount=”1544192” newsize=”9085952” timetaken=”0.017”
reason=”excessive time being spent scavenging” />
<flipped objectcount=”16980” bytes=”2754828” />
<tenured objectcount=”12996” bytes=”2107448” />
<refs_cleared soft=”0” weak=”0” phantom=”0” />
<finalization objectsqueued=”0” />
<scavenger tiltratio=”70” />
<nursery freebytes=”6194568” totalbytes=”9085952” percent=”68” tenureage=”1” />
<tenured freebytes=”3732376” totalbytes=”21635584” percent=”17” >
<soa freebytes=”2651032” totalbytes=”20554240” percent=”12” />
<loa freebytes=”1081344” totalbytes=”1081344” percent=”100” />
</tenured>
<time totalms=”27.043” />
</gc>
<nursery freebytes=”6194048” totalbytes=”9085952” percent=”68” />
<tenured freebytes=”3732376” totalbytes=”21635584” percent=”17” >
<soa freebytes=”2651032” totalbytes=”20554240” percent=”12” />
<loa freebytes=”1081344” totalbytes=”1081344” percent=”100” />
</tenured>
<time totalms=”27.124” />
</af>
where:
af type= nursery indicates the allocation failure occurred when trying to allocate to the nursery.
id= indicates the number of times a nursery allocation has occurred. In this example, this is the 28th nursery allocation.
timestamp= indicates the date and time the allocation occurred.
intervalms= shows the number of milliseconds that have elapsed since the last allocation failure.
minimum requested bytes indicates the number of bytes requested by the allocation that triggered the failure.
nursery, tenured, soa, and loa shows the status of these areas at the time of the failure, including number of free bytes, total bytes, and percentage free.
gc type= indicates that due to the allocation failure, a garbage collection was initiated. In this case, a Scavenger collection.
flipped shows the number of objects that were moved (or flipped) into the Survivor space, as well as the number of bytes flipped.
scavenger tiltratio=x is the percentage that the new space is tilted. Tilting controls the relative sizes of the Allocate and Survivor spaces. The tiltratio is adjusted to maximize the amount of time between scavenges.
For example, if the initial size of the Nursery is 500MB, the Allocate and Survivor spaces begin with 250MB each. When a Scavenge GC is triggered only 50MB remains in the Survivor space. In this case the Survivor space is decreased and Allocate is provided more space.nursery, tenured, soa, and loa shows the status of these areas after the collection, including number of free bytes, total bytes, and percentage free.
time shows the how long it took to complete the collection, in milliseconds.
Tenured Allocation Failure Output
The following is a sample of verboseGC output for an allocation failure in the Tenured area of the heap:
<af type="tenured" id="2" timestamp="Fri Jul 15 13:17:11 2005" intervalms="450.0 57">
<minimum requested_bytes="32" />
<time exclusiveaccessms="0.015" />
<tenured freebytes="104448" totalbytes="2097152" percent="4" >
<soa freebytes="0" totalbytes="1992704" percent="0" />
<loa freebytes="104448" totalbytes="104448" percent="100" />
</tenured>
<gc type="global" id="4" totalid="4" intervalms="217.002">
<expansion type="tenured" amount="1048576" newsize="3145728" timetaken="0.008"
reason="insufficient free space following gc" />
<refs_cleared soft="0" weak="0" phantom="0" />
<finalization objectsqueued="5" />
<timesms mark="4.960" sweep="0.113" compact="0.000" total="5.145" />
</tenured>
</gc>
<tenured freebytes="1612176" totalbytes="3145728" percent="51" >
<soa freebytes="1454992" totalbytes="2988544" percent="48" />
<loa freebytes="157184" totalbytes="157184" percent="100" />
<tenured freebytes="1611632" totalbytes="3145728" percent="51" >
<soa freebytes="1454448" totalbytes="2988544" percent="48" />
<loa freebytes="157184" totalbytes="157184" percent="100" />
</tenured>
<time totalms="5.205" />
</af>
Allocation Failure during Concurrent Mark output
When an allocation failure occurs during Concurrent Mark, one of the following happens:
- The marking performed so far will be discarded, or
- The marking will be saved and used during the subsequent collection.
These two possibilities correspond to the Aborted and Halted concurrent mark events (see the table below).
<af type="tenured" id="4" timestamp="Fri Jul 15 14:08:28 2005" intervalms="17.479">
<minimum requested_bytes="40" />
<time exclusiveaccessms="0.041" />
<tenured freebytes="227328" totalbytes="5692928" percent="3" >
<soa freebytes="0" totalbytes="5465600" percent="0" />
<loa freebytes="227328" totalbytes="227328" percent="100" />
</tenured>
<con event="aborted" />
<gc type="global" id="6" totalid="6" intervalms="17.541">
<warning details="completed sweep to facilitate expansion" />
<expansion type="tenured" amount="2115584" newsize="7808512" timetaken="0.010"
reason="insufficient free space following gc" />
<refs_cleared soft="0" weak="0" phantom="0" />
<finalization objectsqueued="0" />
<timesms mark="17.854" sweep="0.201" compact="0.000" total="18.151" />
<tenured freebytes="2342952" totalbytes="7808512" percent="30" >
<soa freebytes="2108968" totalbytes="7574528" percent="27" />
<loa freebytes="233984" totalbytes="233984" percent="100" />
</tenured>
</gc>
<tenured freebytes="2340904" totalbytes="7808512" percent="29" >
<soa freebytes="2106920" totalbytes="7574528" percent="27" />
<loa freebytes="233984" totalbytes="233984" percent="100" />
</tenured>
<time totalms="18.252" />
</af>
The above sample was generated when the Concurrent Mark was aborted (con event=”aborted”). The output may differ depending on the Concurrent Mark event. The following table lists the valid events:
Event | Description |
|---|---|
Aborted | An allocation failure occurred before the concurrent marking process was able to mark enough objects to be efficient. |
Halted | The concurrent marking process was halted as a result of the allocation failure. |
Final card cleaning | The final card cleaning occurred before the garbage collection was started. The output will display the number of cards cleaned, as well as the number of bytes traced. |
Collection | A concurrent collection has begun. |
Completed full sweep | A full Concurrent Sweep of the heap was completed. The output displays number of bytes swept, as well as the time it took to complete the sweep. |
Viewing verboseGC from Process Commander Monitoring Tools
The monitoring tool (the Monitor Servlet in Version 4.2, or the System Management Application in Version 5.1) allows data from the verboseGC log to be viewed in increments, by specifying a start time and a stop time.
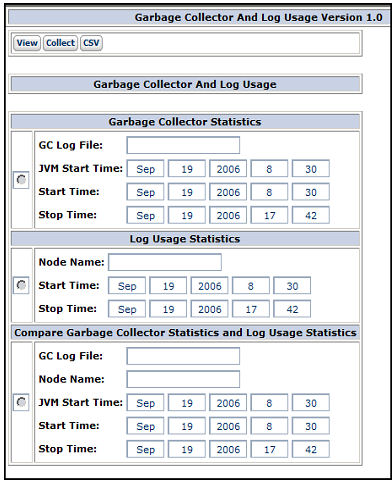
There are three buttons on this window:
Button | Description |
|---|---|
View | View the requested data on the page. |
Collect | Force an explicit garbage collection. NOTES: This button is provided for debugging purposes only – generally it is recommended to allow the JVM to perform the garbage collection on its own. As this button applies to garbage collection, it is grayed out when Log Usage Statistics is chosen. |
CSV | Create a comma-delimited report of the requested data for download. |
Garbage Collector Statistics
This view uses the log file that is generated by the VerboseGC JVM parameter, and organizes the GC data (broken out for each hour) in order to give a picture of the garbage collection activity over time.
NOTE: Verbose GC output must be enabled in the JVM in order to use this feature.
Field | Description |
|---|---|
GC Log File | Enter the full path to the garbage collection log output file, including the log file name. If the location of the log file is included in the JVM options specified when starting the application server, then this field will default to that log file path. |
JVM Start Time | Displays the start time for the system JVM. |
Start Time | Displays the start time parameter for the system JVM, which is when garbage collection began. Change this time to report the garbage collection data to investigate a particular time/date segment. |
Stop Time | Displays the stop time parameter for the system JVM, which is when garbage collection ended. Change this time to report the garbage collection data to investigate a particular time/date segment. |
To view the statistics:
- Click the radio button next to the Garbage Collector Statistics section.
- In the GC Log File field, enter the path to the log file, including the file name.
Example: f:\websphere\tempdir\logs\gclog.out - Set the Start and Stop times.
- Click View to view the report on the screen, or CSV to create a CSV file to download the report to a local machine.
NOTE: The garbage collection statistics all apply to one JVM (one node) in the Process Commander system.
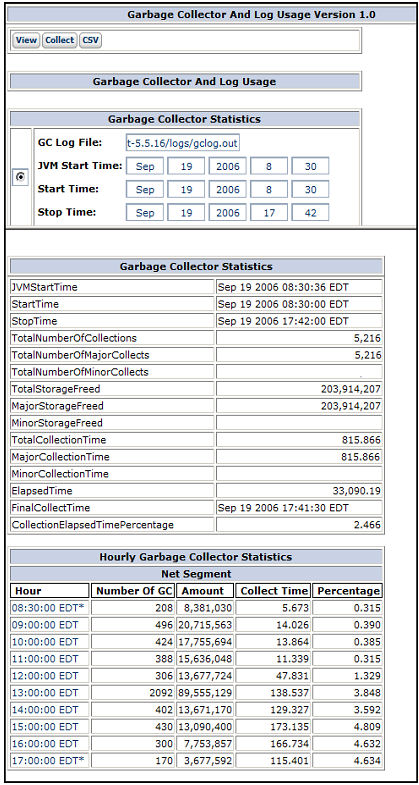
GC Statistic | Description |
|---|---|
JVMStartTime | The start time for the system JVM. |
StartTime | The start time for this report. |
StopTime | The end the time for this report |
TotalNumberOfCollections | The number of garbage collections done in this JVM/node for the specified time period. |
TotalNumberOfMajorCollects | The number of major (or full) garbage collections done in this JVM/node for the specified time period |
TotalNumberOfMinorCollects | The number of minor garbage collections done in this JVM/node for the specified time period. NOTE: Minor Collects are not done in the IBM JVM, the statistic is here for Sun JVMs. |
TotalStorageFreed | The amount of space, in bytes, released in this JVM/node by all garbage collections done in the specified time period. When an object is released in Java, it goes to garbage collection and the space required to hold that object in the JVM is freed. |
MajorStorageFreed | The amount of space, in bytes, released in this JVM/node by major garbage collections done in the specified time period. |
MinorStorageFreed | The amount of space, in bytes, released in this JVM/node by minor garbage collections done in the specified time period. NOTE: Minor Collects are not done in the IBM JVM, the statistic is here for Sun JVMs. |
TotalCollectionTime | The amount of time, in seconds, required by all garbage collections done in this JVM/node in the specified time period. |
MajorCollectionTime | The amount of time, in seconds, required to do the major garbage collections in this JVM/node in the specified time period. |
MinorCollectionTime | The amount of time, in seconds, required to do the minor garbage collections in this JVM/node in the specified time period. NOTE: Minor Collects are not done in the IBM JVM, the statistic is here for Sun JVMs. |
ElapsedTime | The amount of time, in seconds, between the Start and Stop times specified. |
FinalCollectTime | The last time any garbage collection was run in this JVM/node. |
CollectionElapsedTime Percentage | A comparison of the elapsed time to the total collect time. IMPORTANT: If the system is spending more than 3% of its processing time doing garbage collection, it is spending too much time, and a problem exists somewhere in the system setup. Check this measurement, and then if that is high, look at the other collection times to see the collection pattern. |
The Hourly Garbage Collection Statistics show the pattern of garbage collection over time. If the workload on the system is consistent, then the garbage collection should also be consistent. If the workload is consistent but there is a spike in the garbage collection, that should be investigated to see what kind of processing caused the spike.
Column heading | Description |
|---|---|
Hour | The hour (or portion of the hour) included in the specified time period. |
Number of GC | The Total Number of Collections for this hour. |
Amount | The Total Storage Freed, in bytes, for this hour. |
Collect Time | The Total Collection Time for this hour. |
Percentage | The Collection Elapsed Time Percentage for this hour. |
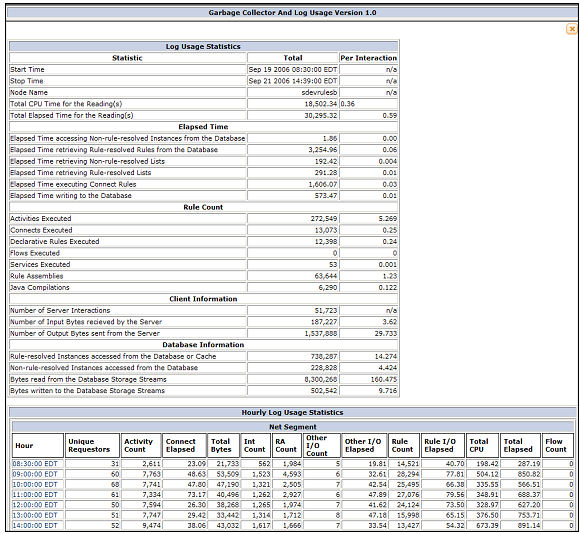
Log Usage Statistics
Log Usage shows overall system activity. Based on the number of interactions, the Log Usage will show various Performance Analyzer counts of system usage, so the system administrator can see what activities are going on from a system-level perspective.
For example, if a user complains that the system is slow at 4 p.m., the system administrator can choose Start and Stop parameters to highlight that time and see whether there was a sudden spike in the number of users, or in activities run by existing users, or some other occurrence that might cause a system slowdown.
To view the statistics:
- Click the radio button next to the Log Usage Statistics section.
- In the Node Name field, enter the name of the node to be viewed.
- Set the Start and Stop times.
- Click View to view the report on the screen, or CSV to create a CSV file to download the report to a local machine.
NOTE: The Log Usage statistics all apply to one JVM (one node) in the Process Commander system.
For definitions of these statistics, reference the Using Performance Tools document,
Tuning Strategy
It is important that the application be tuned before tuning the JVM, to make sure that application processing is efficient. If the JVM is tuned first, then some application problems may be masked.
For example, due to a complex work object structure with lots of drop-down lists requiring data from the BLOB, one customer was loading the data from the entire database for each new work object - over 30MB of data for each work object. The customer had tuned the JVM so that it very efficiently ran under this load, and handled the massive amount of garbage this setup created. But it would have been better if the customer looked at how the application was working and adjusted that, before tuning the JVM.
The Installation Guide details starting settings for the upper and lower parameters of the heap, as follows:
- -Xmx:768m
- -Xms:256m
As pointed out in the Installation Guide, these parameters are minimum amounts only, which enable customers to begin using Process Commander. Your settings may need to be higher, based on your server hardware and the number of other applications on the server. Each application’s memory usage will vary, depending upon the load and type of processing being done. Therefore, each application will require specific tuning, using the verboseGC information.
Tuning Your Application
Unlike some of the other performance areas (which should be checked periodically as the application is being built), tuning for memory usage should be done after the application is completed.
Begin the tuning process by enabling verboseGC. Note your start time and then start the application and run it with several users for some amount of time, making sure to sample all the processing. After all the features have been exercised, close the application, noting the stop time, and review the GC log.
There are a number of application issues that may be highlighted by the data in the verboseGC log, including:
- the volume of garbage
- quick allocation failures
- the same object being loaded repeatedly
- allocation failures consistently doubling
- the size of allocations vs. the number of users
- the heap continuing to grow
When any of these issues occur, it is important to be able to know not only what the JVM is doing, but also what the application is doing. Since it is difficult to tell application processing directly from the verboseGC log, the Process Commander monitoring tool described above shows the verboseGC log information (garbage collection perspective) juxtaposed with the Log Trace information (application perspective).
This combined view of the statistics shows an hourly breakdown of the activity in the system, and allows the system administrator to see what the system is doing against what the JVM is doing, and how they relate. If there is a garbage collection problem, and too much garbage is being generated, is that directly or indirectly related to the activities being run? Is a spike in garbage collection paralleled by a spike in processing? Is the growth across the two areas consistent – i.e., more activities run means more garbage — or is one growing faster than the other? Use this tool to trace garbage collection anomalies to actions in the application.
Volume of Garbage
As shown in the Viewing VerboseGC sections of this support play, each allocation failure message states how many objects were moved to the Survivor Space, as well as the amount of space (in bytes) these objects took up.
<flipped objectcount=’16980” bytes=”2754828”>
If byte size is unusually high (for example, 759,983,392 bytes) in several collections, then review what the application is trying to load. If the number is large enough, the processing it reflects may be triggering some of the ALERT messages in the ALERT log, such as the Interaction Byte Threshold (loading too much from the database into memory). Check both the Pega log and the ALERT log for pointers to determine what the application is doing that requires so much data.
Another facet of the volume is the amount of time that the system spends collecting the garbage. In the Garbage Collector Statistics in the monitoring tool, the CollectionElapsedTimePercentage is shown. If this percentage is higher than 3% for the system, then the system is spending too much time collecting garbage – the amount of time spent will become perceptible to users as a system slowdown.
Check the number of collects, and the amount of garbage collected (Total Storage Freed). High numbers here may point to issues like inefficient database queries (loading the entire BLOB into the clipboard in order to retrieve one property, and then throwing all that data away).
IMPORTANT: The goal of tuning should be that garbage collections take less than 1% of processing time.
Quick Allocation Failures
The first line of the allocation failure message displays the elapsed time since the last Allocation Failure.
<af type=”nursery” id=”28” timestamp=”Thu Apr 12 13:11:45 2007” intervalms=”7898744”>
In the above example, over two hours had passed since the last allocation failure, which is fine. However, there might be allocation failures which happen more quickly:
<af type=”nursery” id=”32” timestamp=”Thu Apr 12 16:05:35 2007” intervalms=”65.016”>
Garbage collections should not happen more often than every 5 seconds or so (at least). If there is a string of allocation failures in the log which are all happening quickly, there may not be enough free space in the heap, or not enough contiguous free space in the heap, to allocate objects, causing frequent failures. Investigate why there is so much allocated space in the heap (see the next section). Are objects not being released when they should, or is the heap too small?
Size of Allocations vs Number of Users
When running a small number of users on an application, each user should only require a reasonably small footprint in the system. To check this, review the amount of garbage that is collected, but also check the amount of memory that is still allocated after a garbage collection.
<gc type=”global” id=”1” totalid=”1” intervalms=”0.000”>
<classloadersunloaded count=”0” timetakenms-“0.12” />
<refs_cleared soft=”0” weak=”4” phanthom=”0” />
<finalization objectsqueued=”6” />
<timesms mark=”3.065” sweep=”0.138” compact=”0.000” total=”3.827”
<tenured freebytes=”304068334” totalbytes=”80534832” percent=”85” />
In the above system, over 500MB of memory is being used (80534832 totalbytes minus 304068334 freebytes) . If there are only 10 users on the system at this point in processing, then each user is using around 50MB of memory on the system. This is excessive, and the reason for this amount of memory usage should be investigated. It is possible that users aren’t logging out correctly, but are creating multiple requestors; it generally takes over an hour for a requestor to automatically log off, so if each user has an extra ten or twenty requestors in the system, that will use up memory quickly. The Requestor Management tool (in the Monitor Servlet in Process Commander 4.2 or the System Management Application in Process Commander 5.1) will show what requestors are currently logged into a node of the system.
Another pointer for this issue would be: if all the users are logged off the system, is the allocation number freed up, or does it still show a small number as % free?
Same Object Loaded Multiple Times
As stated above, the allocation failure message shows space required. If the system is trying to load the exact same size object repeatedly, something odd may be going on in the application – perhaps the same large flow is being loaded over and over.
Example:
<af type=”nursery” id=”28” timestamp=”Thu Apr 12 13:53:13 2007” intervalms=”65.014”>
<minimum requested bytes=”520” />
<time exclusiveaccessms=”0.018” />
<nursery freebytes=”0” totalbytes=”8239104” percent=”0” />
<tenured freebytes=”5965800” totalbytes=”21635584” percent=”27” />
<soa freebytes=”4884456” totalbytes=”20554240” percent=”23” />
<loa freebytes-“1081334” totalbytes=”1081344” percent=”100” />
</tenured>
<af type=”nursery” id=”29” timestamp=”Thu Apr 12 16:04:52 2007” intervalms=”7899744”>
<minimum requested bytes=”520” />
<time exclusiveaccessms=”0.018” />
<nursery freebytes=”3548731” totalbytes=”8239104” percent=”43” />
<tenured freebytes=”4587963” totalbytes=”21635584” percent=”21” />
<soa freebytes=”4521633” totalbytes=”20554240” percent=”21” />
<loa freebytes-“548966” totalbytes=”1081344” percent=”50” />
</tenured>
<af type=”nursery” id=”30” timestamp=”Thu Apr 12 21:36:09 2007” intervalms=”19877299”>
<minimum requested bytes=”520” />
<time exclusiveaccessms=”0.018” />
<nursery freebytes=”6548244” totalbytes=”8239104” percent=”79” />
<tenured freebytes=”2547878” totalbytes=”21635584” percent=”11” />
<soa freebytes=”4874125” totalbytes=”20554240” percent=”23” />
<loa freebytes-“695214” totalbytes=”1081344” percent=”64” />
</tenured>
In the above example, the system is trying to allocate space for an object that is 520 bytes three different times. The application should be examined to see if the same object is being loaded over and over, rather than being cached and reused.
Heap Keeps Growing
When the system is first started up, the verboseGC log will probably show some heap expansion messages:
<af type="nursery" id="28" timestamp="Fri Jul 15 13:11:45 2005" intervalms="65.0 16">
<minimum requested_bytes="520" />
<time exclusiveaccessms="0.018" />
<nursery freebytes="0" totalbytes="8239104" percent="0" />
<tenured freebytes="5965800" totalbytes="21635584" percent="27" >
<soa freebytes="4884456" totalbytes="20554240" percent="23" />
<loa freebytes="1081344" totalbytes="1081344" percent="100" />
</tenured>
<gc type="scavenger" id="28" totalid="30" intervalms="65.079">
<expansion type="nursery" amount="1544192" newsize="9085952" timetaken="0.017"
reason="excessive time being spent scavenging" />
However, after the system has been running for some time, most of the important rules and data should be cached and the heap should not need to keep expanding. If the heap keeps growing, this should be investigated. There may be a memory leak, which happens when objects are not dereferenced, so the system doesn’t know to collect them as garbage.
Memory Leak
As stated above, there may be a memory leak where objects which are no longer being used are still referenced in the system. In this case, the heap will continue to expand until it hits its limit, and then begin giving Java Out Of Memory errors.
The first test for a memory leak is: as all users log off the system, does the garbage collection number go down and the percent free number go up? Check the verboseGC log first thing in the morning, to see what the first couple of allocation failures show. If the percent free number is very high first thing (94% free), then there is probably not a memory leak – some other problem is causing your symptoms.
If the number remains high (“25%” first thing in the morning with one user), then look for issues which are known to cause memory leaks:
- Check the version of the JVM that is running and see if there are memory leak issues with that version
- Check if the system is running Jasper and what version; there are known memory leak issues with some versions
Tuning Your JVM
Tune the JVM after tuning the application. Once the application is as efficient as it can be, run the test again with verboseGC enabled and no load (one or two users) for some specified time, exercising all functionality, including starting up and shutting down the application. Check the verboseGC log to see the heap size at this stage – this should provide a rough guide to the starting size of the heap (the –Xms parameter) that is required.
Then run the system through the same test under a heavy load (many users), exercising the same functionality, and examine the verboseGC log again.
As stated previously, the heap should grow during processing. The heap expands until it reaches a steady state, then remains in that state, which should give a heap occupancy (the amount of live data on the heap at any given time) of around 70%. At this level, the frequency and pause time of garbage collection should be acceptable.
If the heap runs out of space, and Java Out Of Memory errors result, check the application processing. If processing is efficient, the heap may need more space. Increase the –Xmx parameter until the Out of Memory errors cease.
NOTES:
- Do not increase the heap size (-Xmx parameter) until the other tuning has been done! It is vital to not mask other performance issues by expanding the heap size, perhaps at the expense of other applications running in the same JVM.
If the heap is fully expanded (at a steady state) but the occupancy level is greater than 70%, increase the –Xmx value so that the heap is not more than 70% occupied.
- The heap should not be made larger than the physical memory in the machine. If it is larger, then some allocations will be paged to disk, which gives slower performance.
Also, set up the system to avoid compactions. Compaction is usually caused by requests for very large memory allocations. Analyze requests for large allocations and avoid them if possible.
Enabling Concurrent Mark
Concurrent Mark processing should not be automatically enabled in a system. Background marking of the garbage can make garbage collection more efficient, but since there are background processes using CPU resources, it can also be less efficient.
The first factor to consider when determining whether to enable Concurrent Mark is what sort of processing will be done by the application. Since Concurrent Mark does background garbage marking, this will use some resources for overhead, but will decrease the amount of time users can’t access the system during garbage collection, thus increasing response time. Therefore, for any system where response time to users is important, Concurrent Mark should be considered.
If there are no direct users for the Process Commander application – in other words, if Process Commander is being used as a batch processor – then Concurrent Mark should not be enabled. For batch processing, throughput is more important than response time and the uninterrupted stop-the-world garbage collection gives better throughput than background collection.
For applications with direct users, where response time is important, the next step is to analyze the GC log to determine whether Concurrent Mark is useful for your particular application.
The background process of concurrent marking does take some time – at least 30 seconds. If allocation failures are occurring in the system faster than that, then the verboseGC log will consistently show that the concurrent marking has been ABORTED (con event-Aborted).
<af type="tenured" id="4" timestamp="Fri Jul 15 14:08:28 2005" intervalms="17.479">
<minimum requested_bytes="40" />
<time exclusiveaccessms="0.041" />
<tenured freebytes="227328" totalbytes="5692928" percent="3" >
<soa freebytes="0" totalbytes="5465600" percent="0" />
<loa freebytes="227328" totalbytes="227328" percent="100" />
</tenured>
<con event="aborted" />
<gc type="global" id="6" totalid="6" intervalms="17.541">
<warning details="completed sweep to facilitate expansion" />
<expansion type="tenured" amount="2115584" newsize="7808512" timetaken="0.010"
reason="insufficient free space following gc" />
The developer should get the time between allocation failures to be at least 30 seconds, and then implement optavgpause to enable Concurrent Mark. This will then allow the system to take advantage of background garbage collection processing.
Ongoing Tuning
Although both the application and the JVM may have been tuned initially, the tuning work is not done. Tuning does not need to be done every week or every month. However, whenever a large change is made to the system, the system administrator should re-examine the verboseGC output to ascertain whether additional tuning needs to be done. Such changes might include:
- Adding a group of new users. Adding one user will probably not require retuning the system, but adding multiple users may.
- Adding or changing hardware.
- Putting new RuleSets into production. New RuleSets mean new processing, which may require additional allocations.
- Upgrading to a new Process Commander version.
Troubleshooting an Out-of-Memory Error
When diagnosing an out-of-memory error, it is important to consider the information that comes after the java.lang.OutOfMemoryError text. The following are some examples:
- Java heap space – This indicates that an object could not be allocated in the heap. This may be caused by the heap being too small or objects not being garbage collected because the application still holds references to them.
- PermGen Space – This indicates that the Permanent Generation is full. The Permanent Generation may need to be increased using the –XX:MaxPermSize parameter.
- Requested array size exceeds VM limit – This indicates that the application attempted to allocate an array larger than the heap.
Another factor to consider in troubleshooting out-of-memory exceptions is the -Xmxcl parameter setting. This parameter sets the maximum number of classloaders allowed in the JVM. Whether it is the cause of your error depends on the IBM JVM 5.0 in use:
- If JVM 5.0 SR-4 or earlier, the default setting for -Xmxcl is 8192 classloaders. Exceeding this value will cause an out-of-memory exception.
- If JVM 5.0 SR-5 or later, an unlimited number of classloaders are allowed, and the classloader count will not cause an out-of-memory error.
If you see this error, and your JVM 5.0 is SR-4 or earlier, updating a JVM to SR-5 or later should correct an -Xmxcl out-of-memory error, and Pegasystems recommends you upgrade the JVM.
If you choose not to upgrade, set -Xmxcl to the Pega-recommended value of 22,000. On the command line, enter: -Xmxcl22000.
If you see an out-of-memory error, and your JVM 5.0 is SR-5 or later, the cause is not classloaders, but one of the causes noted earlier, for example a heap space issue.
Additional Resources
As stated above, IBM has published the IBM Developer Kit and Runtime Environment Java 2 Technology Edition Diagnostics Guides. There are different versions of this Guide available as PDF files from the IBM website.
For Java 5: Download the PDF from: ![]() http://www-128.ibm.com/developerworks/java/jdk/diagnosis/
http://www-128.ibm.com/developerworks/java/jdk/diagnosis/
Of special interest for this support play:
- Chapter 2: Understanding the Garbage Collector
- Chapter 30: Garbage Collector Diagnostics
For Java 1.4.2: Download the PDF from ![]() http://www-128.ibm.com/developerworks/java/jdk/diagnosis/142.html
http://www-128.ibm.com/developerworks/java/jdk/diagnosis/142.html
Of special interest for this support play:
- Chapter 2: Understanding the Garbage Collector
- Chapter 31: Garbage Collector Diagnostics
WebSphere Application Server v6 Diagnostic Data:
![]() http://www.redbooks.ibm.com/abstracts/redp4085.html?Open
http://www.redbooks.ibm.com/abstracts/redp4085.html?Open
Diagnostic Tool for Java Garbage Collector:
![]() http://www.alphaworks.ibm.com/tech/gcdiag
http://www.alphaworks.ibm.com/tech/gcdiag
IBM Pattern Modeling and Analysis Tool for Java Garbage Collector:
![]() http://www.alphaworks.ibm.com/tech/pmat
http://www.alphaworks.ibm.com/tech/pmat
HeapRoots:
![]() http://www.alphaworks.ibm.com/tech/heaproots
http://www.alphaworks.ibm.com/tech/heaproots
HeapAnalyzer:
![]() http://www.alphaworks.ibm.com/tech/heapanalyzer
http://www.alphaworks.ibm.com/tech/heapanalyzer
Additional PDN Articles:
- Using Performance Tools (PAL), available for V4.2 and for V5.1. Follow a link on the System Tools page.
- How to detect and remedy the performance impact of Obj-List methods and list view reports
- Platform Bulletin: IBM JVM Issues
Need Further Help?
If you have followed this Support Play, but still require additional help, you can contact Global Customer Support by logging a Support Request.
Previous topic Support Play: Tuning the IBM JVM 1.4.2 for performance Next topic Support Play: Tuning the Sun JVM 1.4.2 and 5.0 for performance