
Post files and links with pxPostMessage API
Valid from Pega Version 7.1.4
The pxPostMessageAPI now supports text messages, file attachments, and hyperlinks. You can programmatically update Pulse streams using this API from activities or SLA rules.
Change logic does not work in Report Editor
Valid from Pega Version 7.1.2
The Report Editor change logic button does not work. As a workaround, use the rule form to change the logic.
Case Management
Valid from Pega Version 7.1.4
This release has continued to focus on improving the functionality of the design environment with improvements to the Case Designer and stage configuration. Additional end user capabilities were also added to allow for processing a wider variety of cases, for those with and without stages and improved bulk processing handling.
- Flow action processing now uses the primary page instead of the interest page when using case/stage local actions, so that embedded flows are properly populated.
- Case-wide local actions rely on pzInternalStageFlow when there are no active, non-hidden assignments on the case. These case-wide local actions will now appear on a stage-less flow with no assignments.
- If a (valid) error is displayed in the outline view, saving or clicking around will not delete the error - the error will remain as a reminder to the developer to solve whatever problem is being flagged.
- May now add Cascading Approval validation and edit the parameters from the Case Designer Stage and Step page.
- Page labelling ("Page 1 of X") appears in the history list presented in the audit tab.
- The bulk processing feature has been enhanced.
- The Outline View functionality was changed so that the visible page will no longer refresh each time a flow is edited.
- The Post value was added to the instructions text field, so data isn't lost between nodes in the outline View.
- When Assign to Operator or workbasket is included as a filter, the bulk processing gadget is supposed to get a list of assignments. The UI for the results was enhanced for assignments to include a column for instructions so that the different assignments on the same work item can be distinguished.
- When designing a case type’s stages, it is no longer possible to skip the last stage (by using the "skip stage when" setting). When creating or editing the last stage, developers may no longer set a skip when rule; if tried, the system will display a warning and prevent that. If a Skip When rule is set up for a stage, and then all the intervening stages are deleted so that this stage becomes the last stage, the warning will display, and the Skip When rule will not be visible. If another stage is then added after that, the Skip When rule becomes visible again.
- When one or more locked work objects are processed using the Process Selected Items button, the action will be performed on the selected work objects. If the action is successful, a green tick appears on the work object. If it is not successful, a red cross will appear.
- When the topmost RuleSet in the RuleSet Stack is locked, customers may now open up Outline View by clicking "Configure Process Details" and make exploratory changes to experiment. Because the RuleSet is locked, these changes may not be saved, but the experiment can be tried.
Create, Save As, and Specialization forms
Valid from Pega Version 7.1.4
The familiar “New” and “Save As” forms have been streamlined to make record creation faster and more intuitive. You can easily target a specific layer in your application stack, interactively define the record’s configuration and select only those circumstance definitions that make sense for your use case.
While the underlying behavior for creating a record is not new for this release, the redesigned UI of these forms and new defaulting strategy for fields is worth noting:
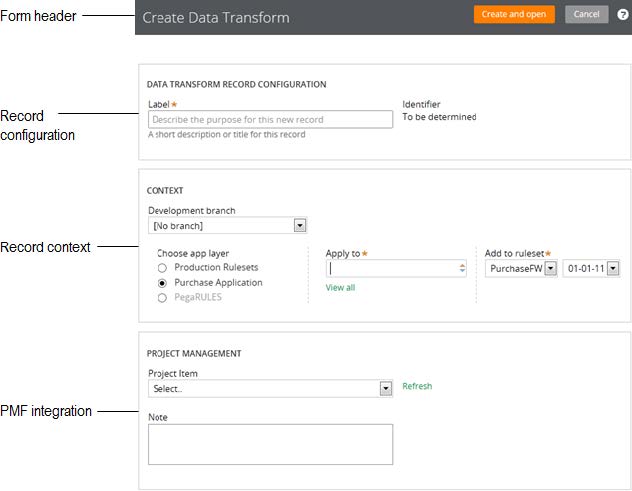
To launch these forms, use one of the new options found in the action area of the form header:
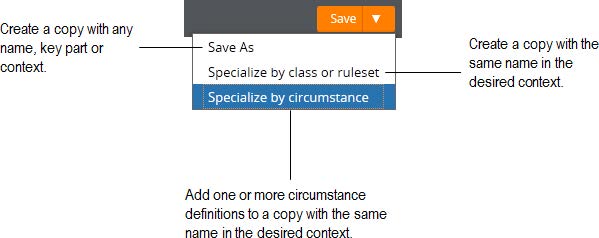
Note that not all record types support the ability to specialize by circumstance.
For more guidance on how to use the Create, Save As and Specialization forms, please refer to: Intuitive record creation and specialization
Flow rules not supported in IE8
Valid from Pega Version 7.1.1
In versions prior to 7.1.2, flow rules do not open in Internet Explorer 8 (IE8). Upgrade your system to the latest version of PRPC or access flows from another supported browser.
Quickly create ad-hoc cases
Valid from Pega Version 7.1.4
The My Cases work area on the Case Manager portal introduces a Quick Create feature that lets users create cases and assign tasks that are not included in the processing of business cases (instances of case types defined in the Cases Explorer). For example, a manager can create a case and a task to set up a phone conference with her staff, or a reminder to enroll in an online seminar. Users can also set up a series of tasks to represent all they work they need to do to accomplish a specific goal.
Extended currency control
Valid from Pega Version 7.1.4
The currency control can now display a different currency than the locale currency. This means a user in one country can view amounts that are designated in a foreign currency, using that currency's international conventions. For example, a credit card transaction in Germany might need to be posted in US dollars.
Responsive layout groups and grids
Valid from Pega Version 7.1.4
The Responsive UI was introduced in Version 7.1, and has now been enhanced in two areas, to create an entirely responsive UI.
PRPC 7.1.4 introduces the Layout Group control, which can render its contents as “tabs,” “accordions,” or as a “menu.” The rendering choice is driven through the presentation layout (the skin), which presents the information responsively: a “tab” at a certain breakpoint can turn into an “accordion” or a dropdown-style menu, depending upon what format would be most appropriate for the device/screen size being used.
The grid functionality has also been enhanced, so that grids may be displayed on a tablet or a phone without the need for horizontal scrolling, offering the optimum experience on a mobile device. A PRPC Grid Layout now supports responsive breakpoints in the skin definition in which columns can drop off or be consolidated according to screen size.
Designers will be able to mark columns in the grid by importance, and at the first breakpoint, the columns marked as “less important” will be dropped off first. At the second breakpoint, the grid turns into a “fat list,” with the most important column displaying as a heading for each item in the “fat list.” Styling options can be associated with these breakpoints.
Improved accessibility support
Valid from Pega Version 7.1.4
PRPC support for accessibility has been enhanced to allow applications to better meet the standards of the Web Content Accessibility Guidelines (WCAG), 2.0 AA.
Input Method Editor (IME) support
Valid from Pega Version 7.1.4
PRPC has added support for the Microsoft Windows Input Method Editor (IME), to allow developers to enter complex characters in four different East Asian languages using the standard keyboard. The IME is a way to create input using a keyboard, by using additional windows for character editing or selection, in order to facilitate entry of alternate writing systems.