Reporting
Pega Platform provides a convenient way to retrieve specific application data and present the information in the form of comprehensible reports. For example, in an insurance application, you can create a report about clients that own vehicles, and then use that report to offer them new insurance contracts.
The reporting functionality provides you with statistics that you can analyze to improve your business. Pega Platform offers the following efficient ways to gather application data for interpretive purposes: insights and traditional reports.Insights
Insights offer a wide range of customizable options thanks to which you can, for example, present data as interactive charts that you can then drill down to retrieve more specific information. By using various options, you can create unique insights that you can then share to specific groups or individuals. For example, in a transportation application, you can customize a chart-based insight about the most attended train routes, and then drill down to the nationality of each passenger to discover the number of foreign tourists.
Insights are accessible in the Explore Data functionality, which can use either Cosmos React or Theme Cosmos environments, thanks to which you can add insights to the landing pages of applications.
For more information, see Visualizing data with insights.
Traditional reports
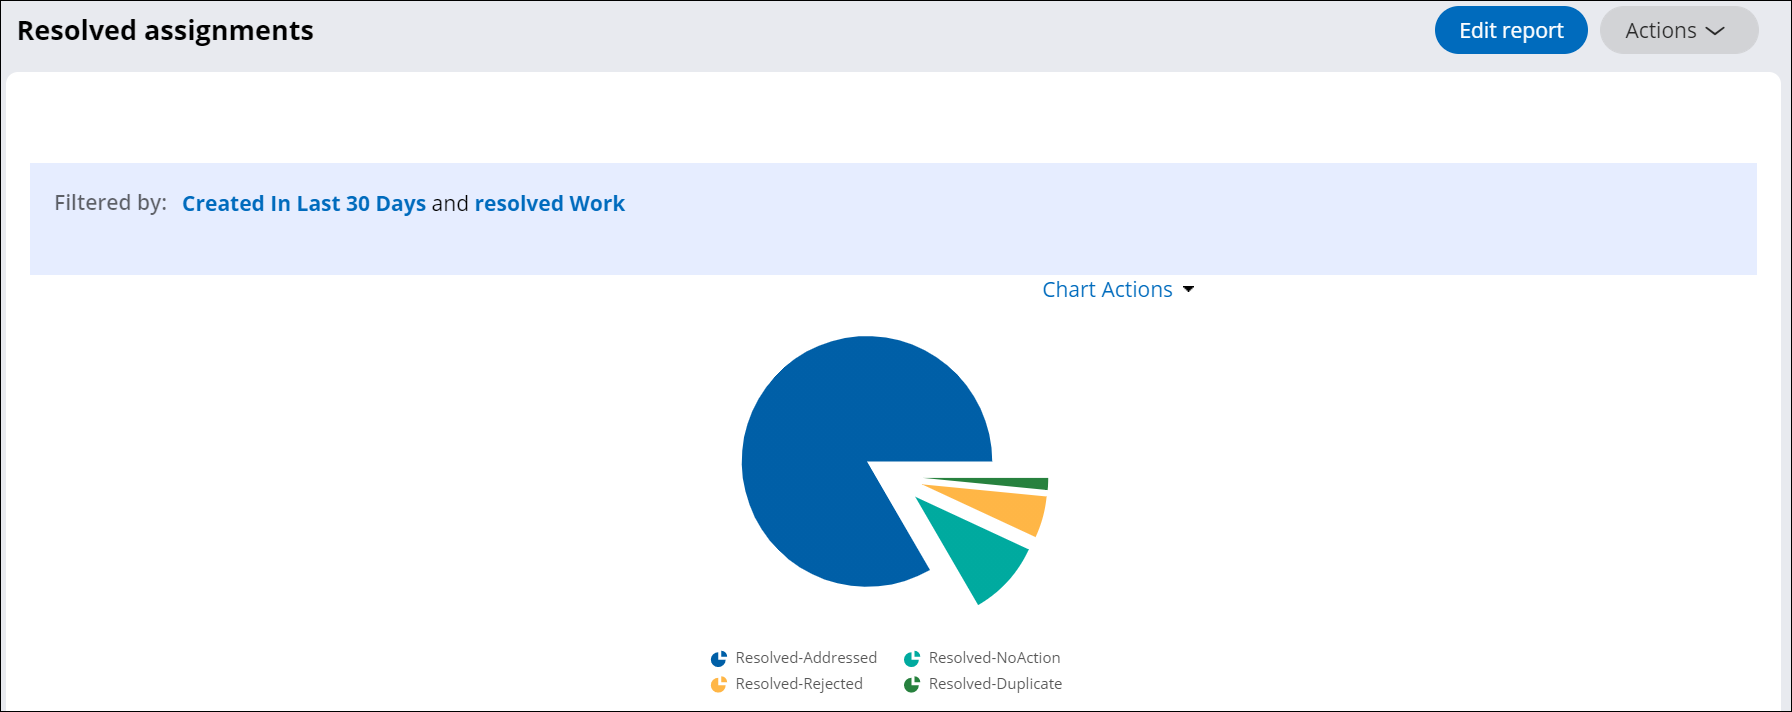
You can present data as extensive list reports that provide detailed information in columns, or as summarized reports that provide statistics. The latter report type is customizable with static charts that you can use to exemplify certain data.
Each report is editable with various options such as sorting, grouping or filtering, and so you can adjust the content to constantly changing business requirements. For example, in a retail application, in a list report about orders, you can filter the results by category, and then sort them from highest to lowest to analyze selling trends. For more information, see Report types.
- Report categories
You can distinguish reports from each other by organizing them into categories.
- Report types
You can analyze data from different perspectives depending on the report type that you use. You can monitor detailed lists of the events that occur in your application, or view summarized numbers of the occurrences. For example, you can create a report that lists the number of cases that users resolve within the last seven days, and analyze the report to assess user performance.
- Report Browser
Report Browser provides access to all reports that are available to you. You can use this interface to search for a report about resolved cases, and open that report to asses user performance.
- Creating a report
Achieve greater precision and flexibility in data retrieval and analysis by creating custom reports. For example, you can create a comprehensive list report that includes detailed information about company sales within specific period to analyze the performance of salesmen.
- Running a report
Access and analyze relevant information in clear and organized reports. For example, you can monitor system performance by running regular reports that can contain such details as the time spent to perform a task.
- Editing a report
Adapt to dynamic needs and continuously improve your reporting capabilities by modifying your reports. You can change the way your report displays information or filters data for different audiences.
- Creating advanced reports
Facilitate the process of data analysis by presenting the data that you retrieve from the database in the form of a table.
- Visualizing data with insights
Insights help you conveniently explore and analyze application data, such as company sales, bugs, and team assignments. You can use insights to retrieve specific data, and present the data as a list or an interactive chart.
- Troubleshooting Reporting issues
Ensure that the Reporting functionality in your application works as intended by learning about potential issues and their resolutions.
Next topic Report categories