Forecast management improves a sales organization’s ability to predict the sales cycle
by providing rollups of the sales pipeline by category, quarter, and territory. Territory owners
at all levels can adjust opportunity amounts, close dates, and forecast categories to allow for
the most realistic sales picture possible at each territory level. Behind every element in the
forecast is an audit of the recent changes, with an indication of how it affects a forecast, so
that the sales team always knows why and when the forecast was updated. Use forecast management
to review pipeline status for an entire territory or for an individual operator.
Note: The basic features of forecast management are ready for use with Pega Sales Automation as part of an MLP implementation and do not require additional
configuration. However, if you want to use close plans and opportunity splits with forecast
management, you must enable these features for your implementation in App Studio. For more information, see Enabling application features.
As a sales manager, on the Forecast screen, you can use the following
features and manage the following sales processes:
View and analyze weighted or unweighted data.
For more information, see "Viewing
weighted and unweighted data".
View and analyze AI-based, predictive data.
For more information, see "Using predictive
forecast".
Set up, view, and analyze Close plans.
For more information, see "Using close
plans".
View and analyze renewals.
For more information about renewals, see Renewals.
As a sales representative, you can view any updates your manager makes to the forecast by
selecting an opportunity and clicking Recent changes on the Forecast
screen.
Forecast tables display forecast categories based on the opportunity categories defined by
Sales Ops in the Tools menu. For more information, see Configuring list values.
Time periods in the forecast tables are based on the time periods defined by Sales Ops in the
Tools menu. By default, forecast tables display Q1, Q2, Q3, and Q4. For more information, see
Optional: Sales goals.
Viewing weighted and unweighted data
Use the Forecast screen to view opportunity data amounts without any adjustments
(unweighted), or multiplied by the win probability of that opportunity
(weighted).
In the navigation pane of the User portal, click
Forecast.
To see only individual for business-to-consumer (B2C) selling mode or business
for business-to-business (B2B) opportunity data, select
Individual or Business.
In the Territory list, enter or select any territory,
for example, North West.
Optional: In the Override level list, select
Opportunity to see the overridden opportunity amounts
that you changed or want to change for any teammate.
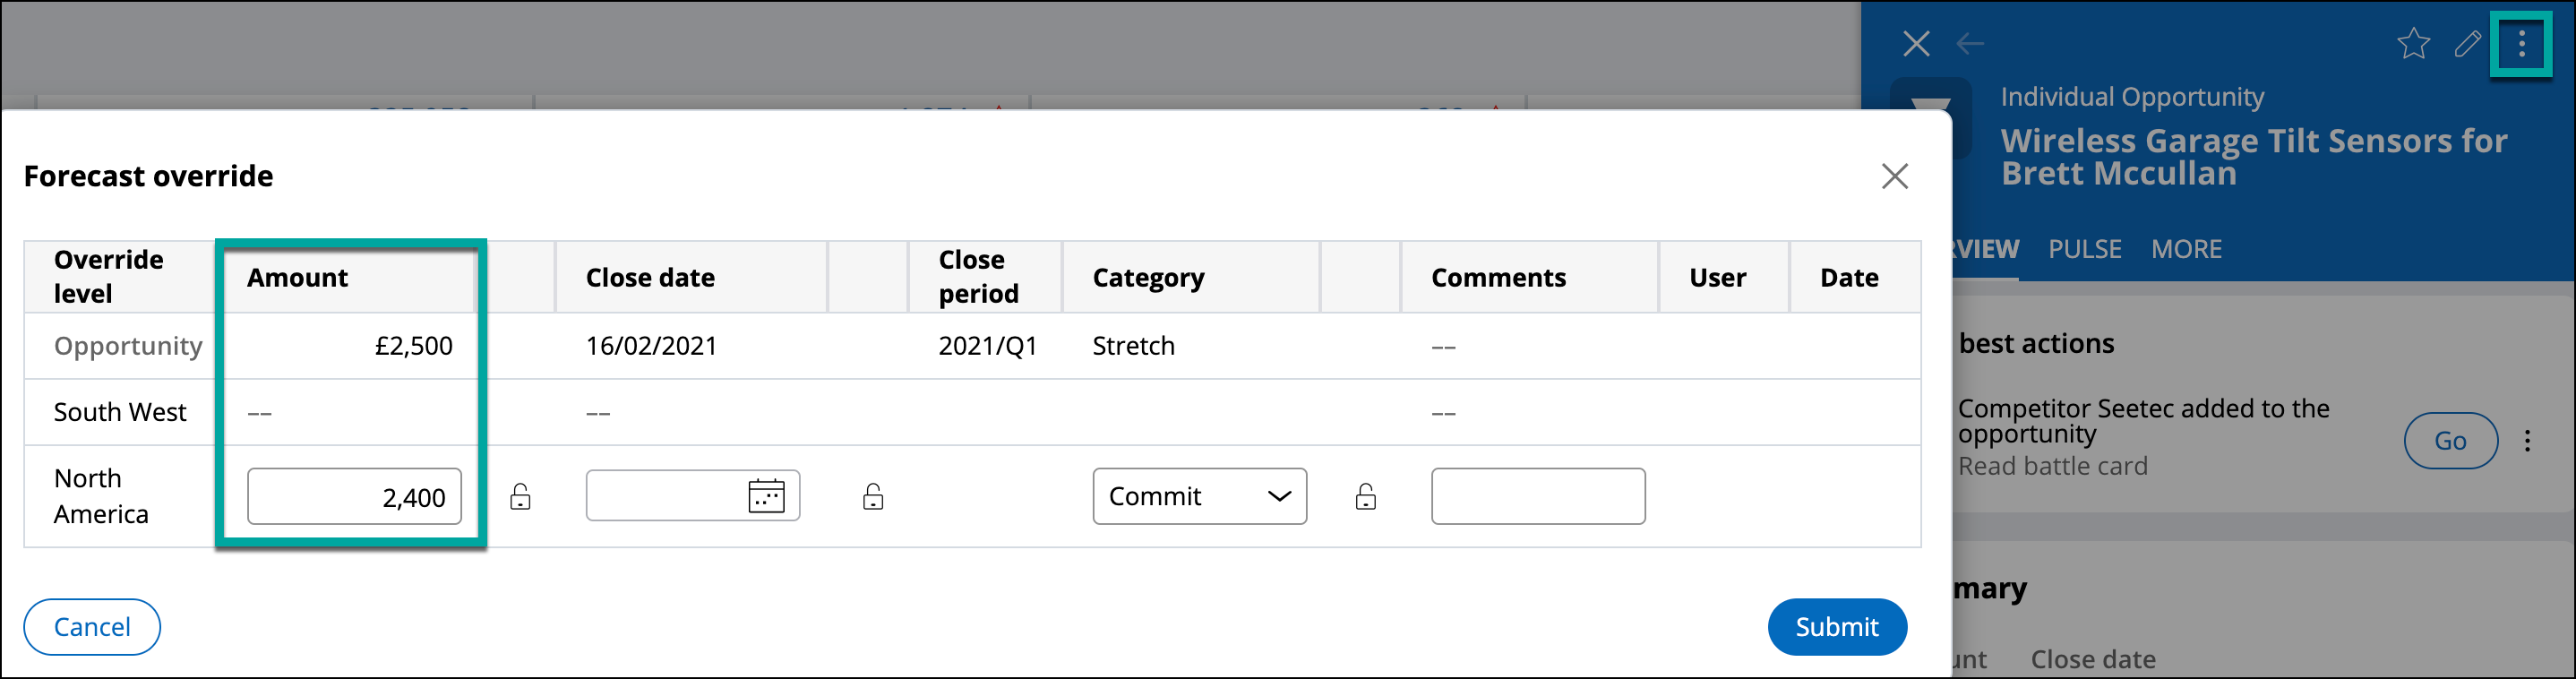
As a manager, you can override the opportunity amount and adjust it to the
desired sales goal. This adjusted value will not affect the actual opportunity
value, but is used only for data visualization purposes.
To change the amount on an opportunity, open it in preview mode and
click MoreForecast.
Enter a new amount and click Submit.
Overriding the amount value in the preview mode
Optional: In the Sales types list, select whether you want to see
all sales types, only new business deals, or only renewals:
To see all sales types, leave the Sales types
list unchanged.
To see only new business deals, select New
business.
To see only renewals, select Renewal. For more
information, see Renewals.
Optional: Click Advanced and select from the following
options:
In the Year list, select a year to see the
opportunity data for that year.
If you are using opportunity splits, select the Show revenue
splits check box and enter or select a team member in
the Team member list. For more information, see
Configuring
opportunity splits.
Select Rolling to change the default yearly data
display to show only the next four quarters. For example, if you are in
Q2, the table shows Q2, Q3, Q4, and Q1.
In the Opportunity products list, enter or
select any product to see opportunities only for that product.
If you are using PRM, in the Opportunity partner
list, enter or select a partner to see the opportunity data for this
partner.
Click Filter.
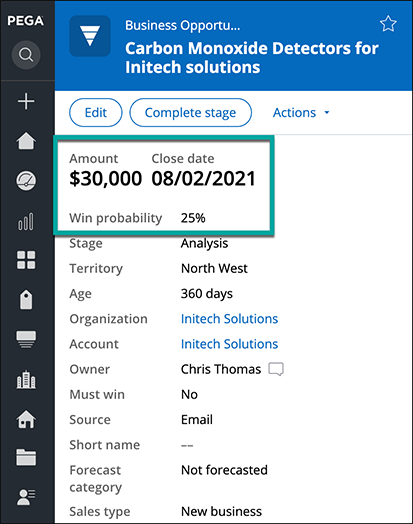
To see opportunity amounts multiplied by the win probability, select
Weighted.
A weighted opportunity amount on the opportunity screen
In the figure above, for this opportunity the system shows $30,000. Win
probability is based on the stage an opportunity is at, for example, in the
Analysis stage win probability is set by default to 25%, but for the Proposal
stage it is set to 50%. The more advanced the opportunity is, the higher the win
probability is.
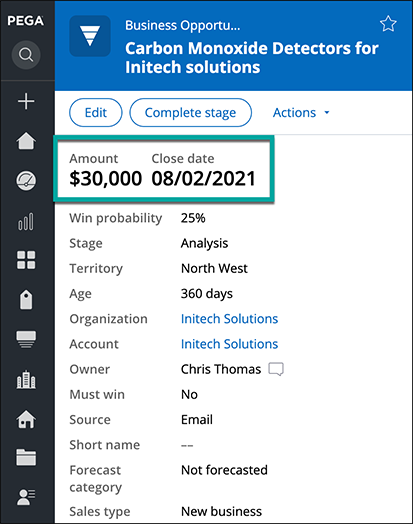
Optional: To see opportunity amounts without any adjustments (unweighted), click
Unweighted.
An unweighted opportunity amount on the opportunity screen
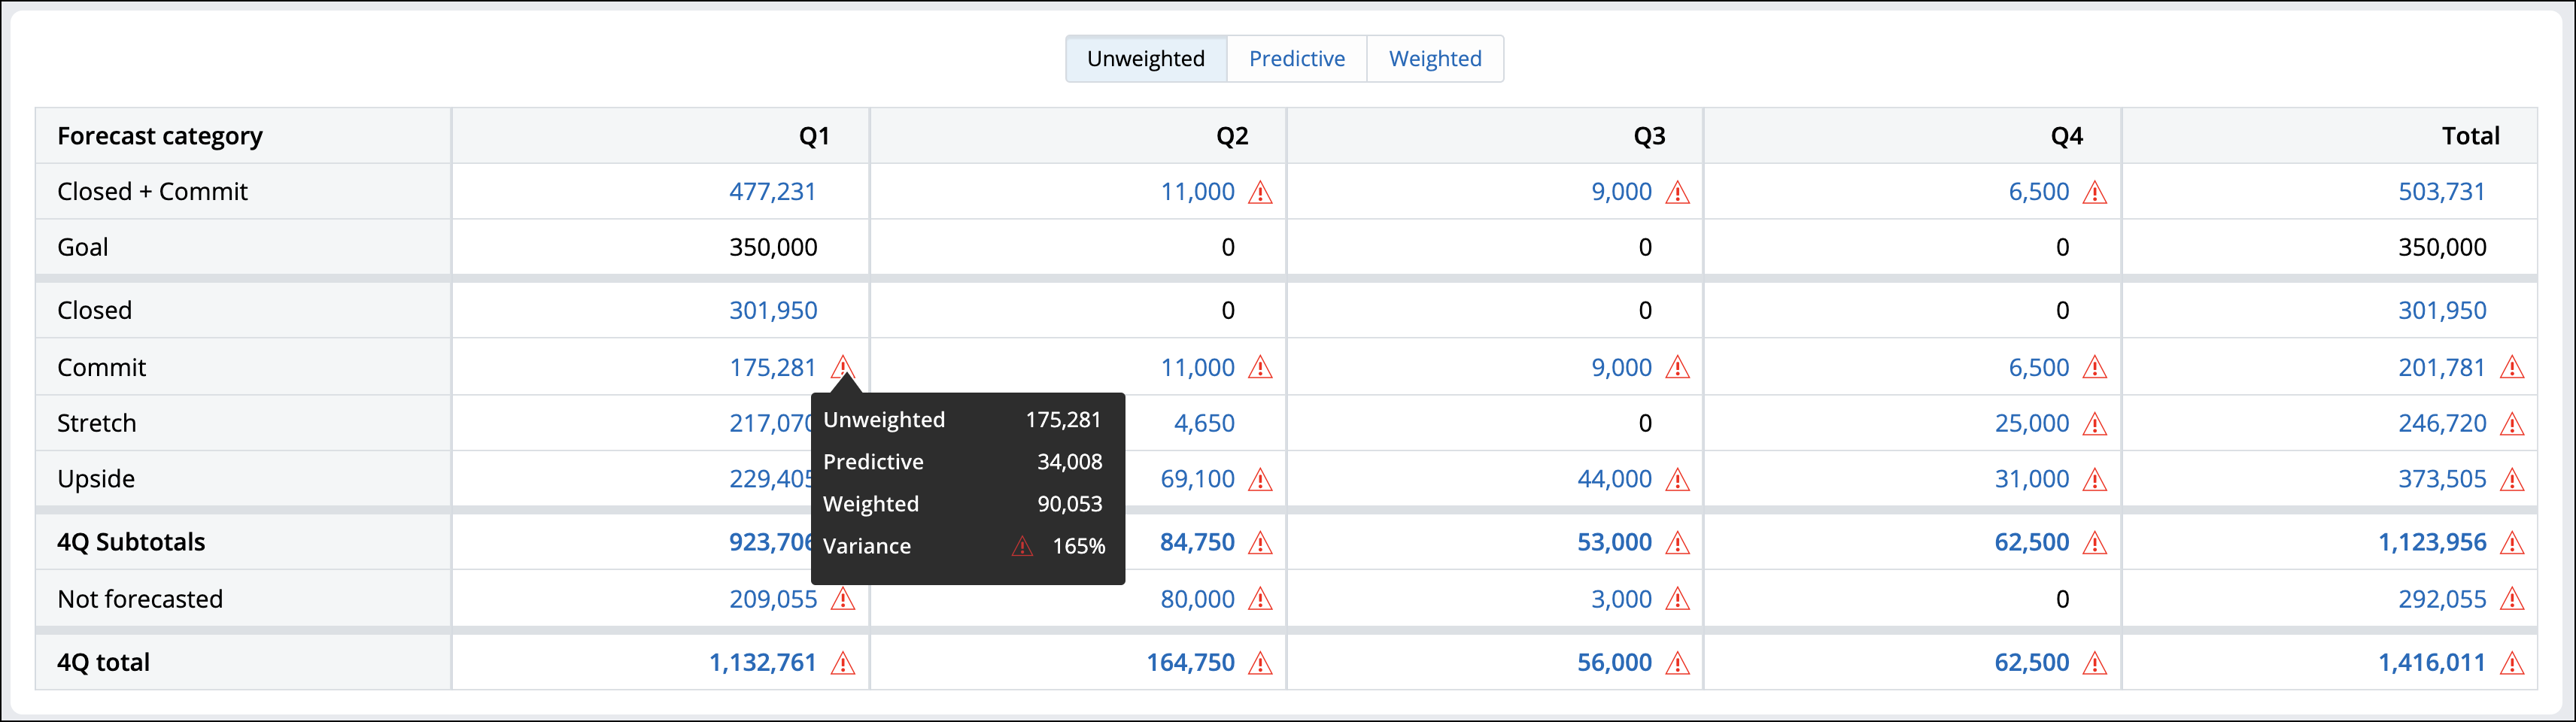
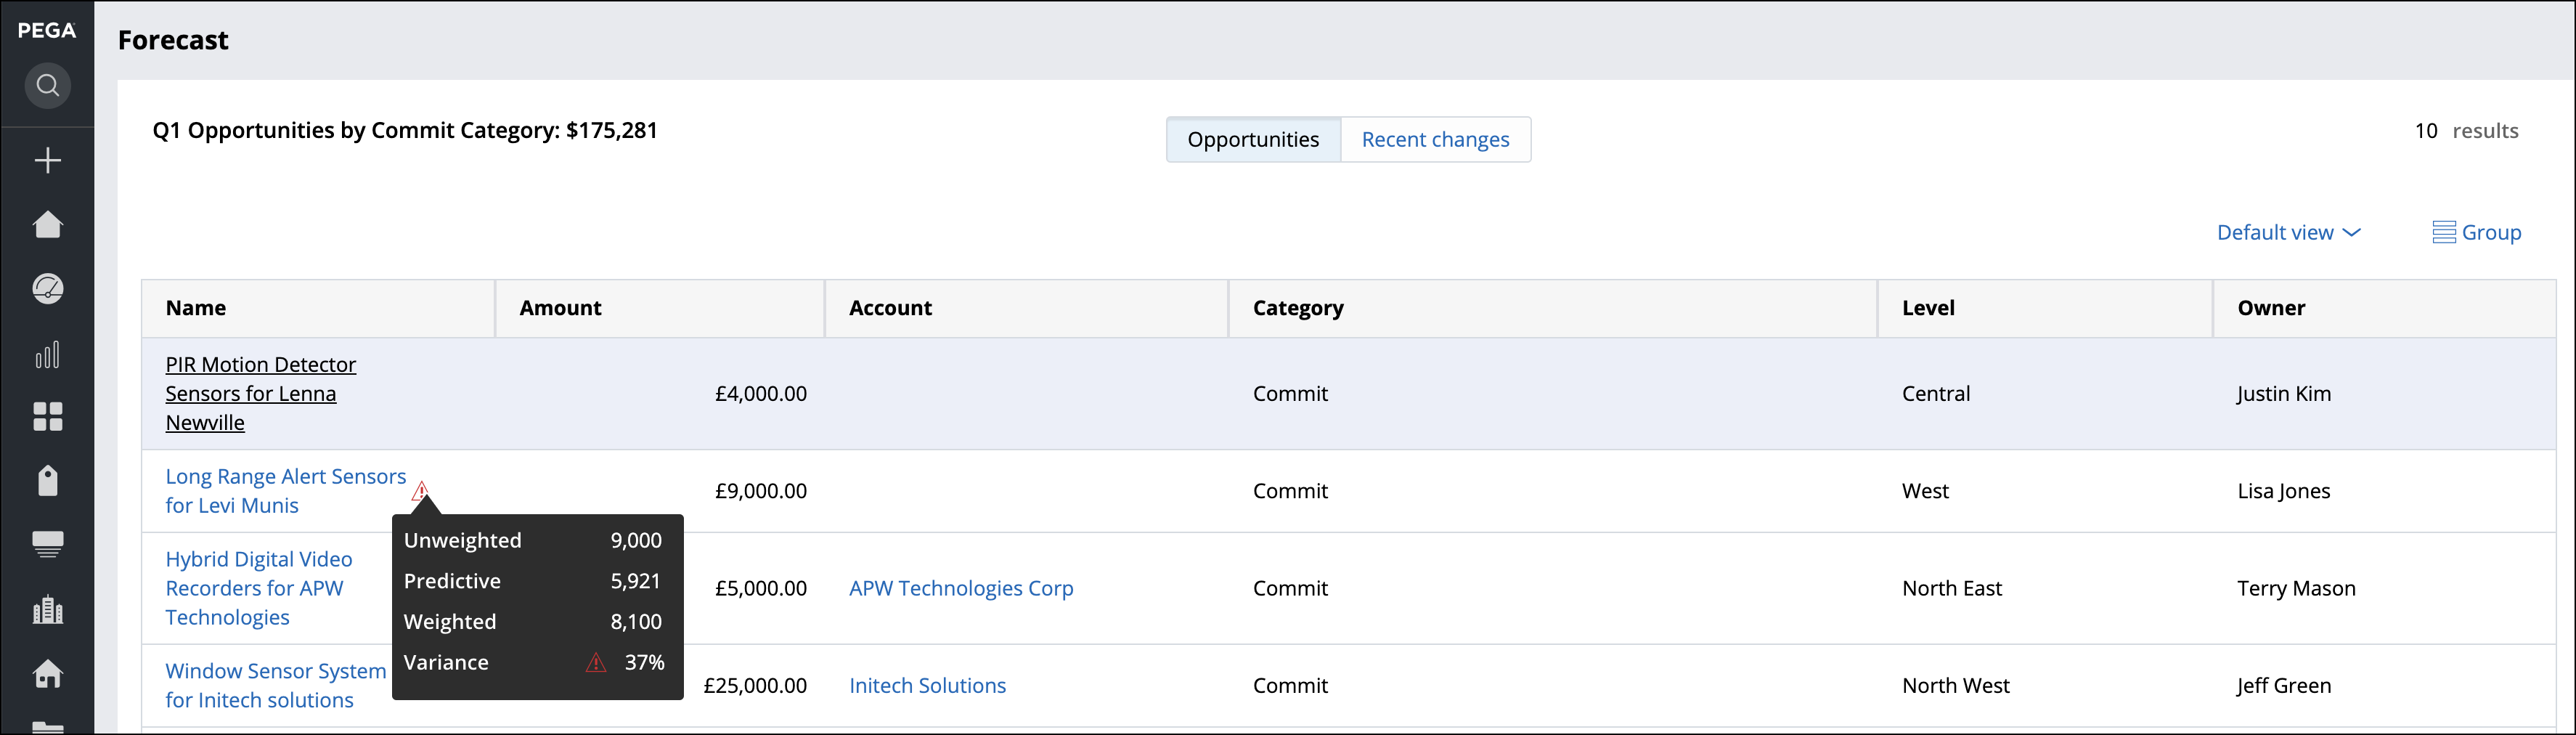
View the opportunity data.
Hover over any red warnings to see details of the data variance.
The system displays a red warning if the discrepancy between the
predictive and weighted amounts are higher than the set threshold. By
default, discrepancy is set to a 20% variance. Change the default value
in the App Studio settings for forecasts. For more
information, see Enabling application features.Unweighted data view with warnings
You can see both weighted and unweighted amounts for
opportunities currently in the Commit stage in Q3.
Optional: To see a detailed view of an opportunity in a second table, select any
opportunity in the table.
Detailed view after selecting an opportunity
Using predictive forecast
Use predictive forecasts to help sales teams compare sales-generated forecasts with
AI-generated predictions for each territory. Alerts draw attention to forecasts that vary
beyond a configurable threshold between sales numbers and artificial intelligence
numbers.
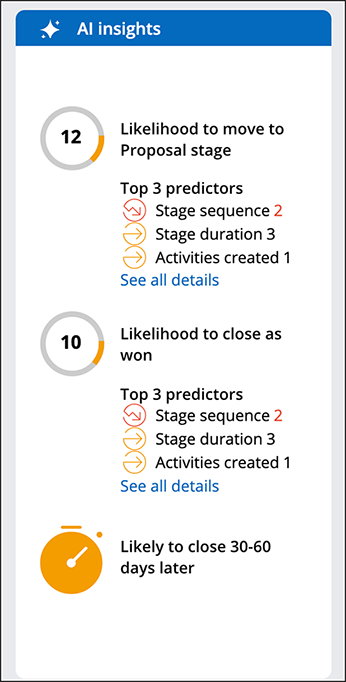
You can view predictive forecasts based on AI insights and attributes set on the
opportunity, as well as the selling history of a sales rep.AI insights on the opportunity screen
View predictive forecast data by performing the following example steps:
In the navigation pane of the User portal click
Forecast.
Apply filtering.
For more information, see "Viewing weighted and unweighted data".
Select Predictive.
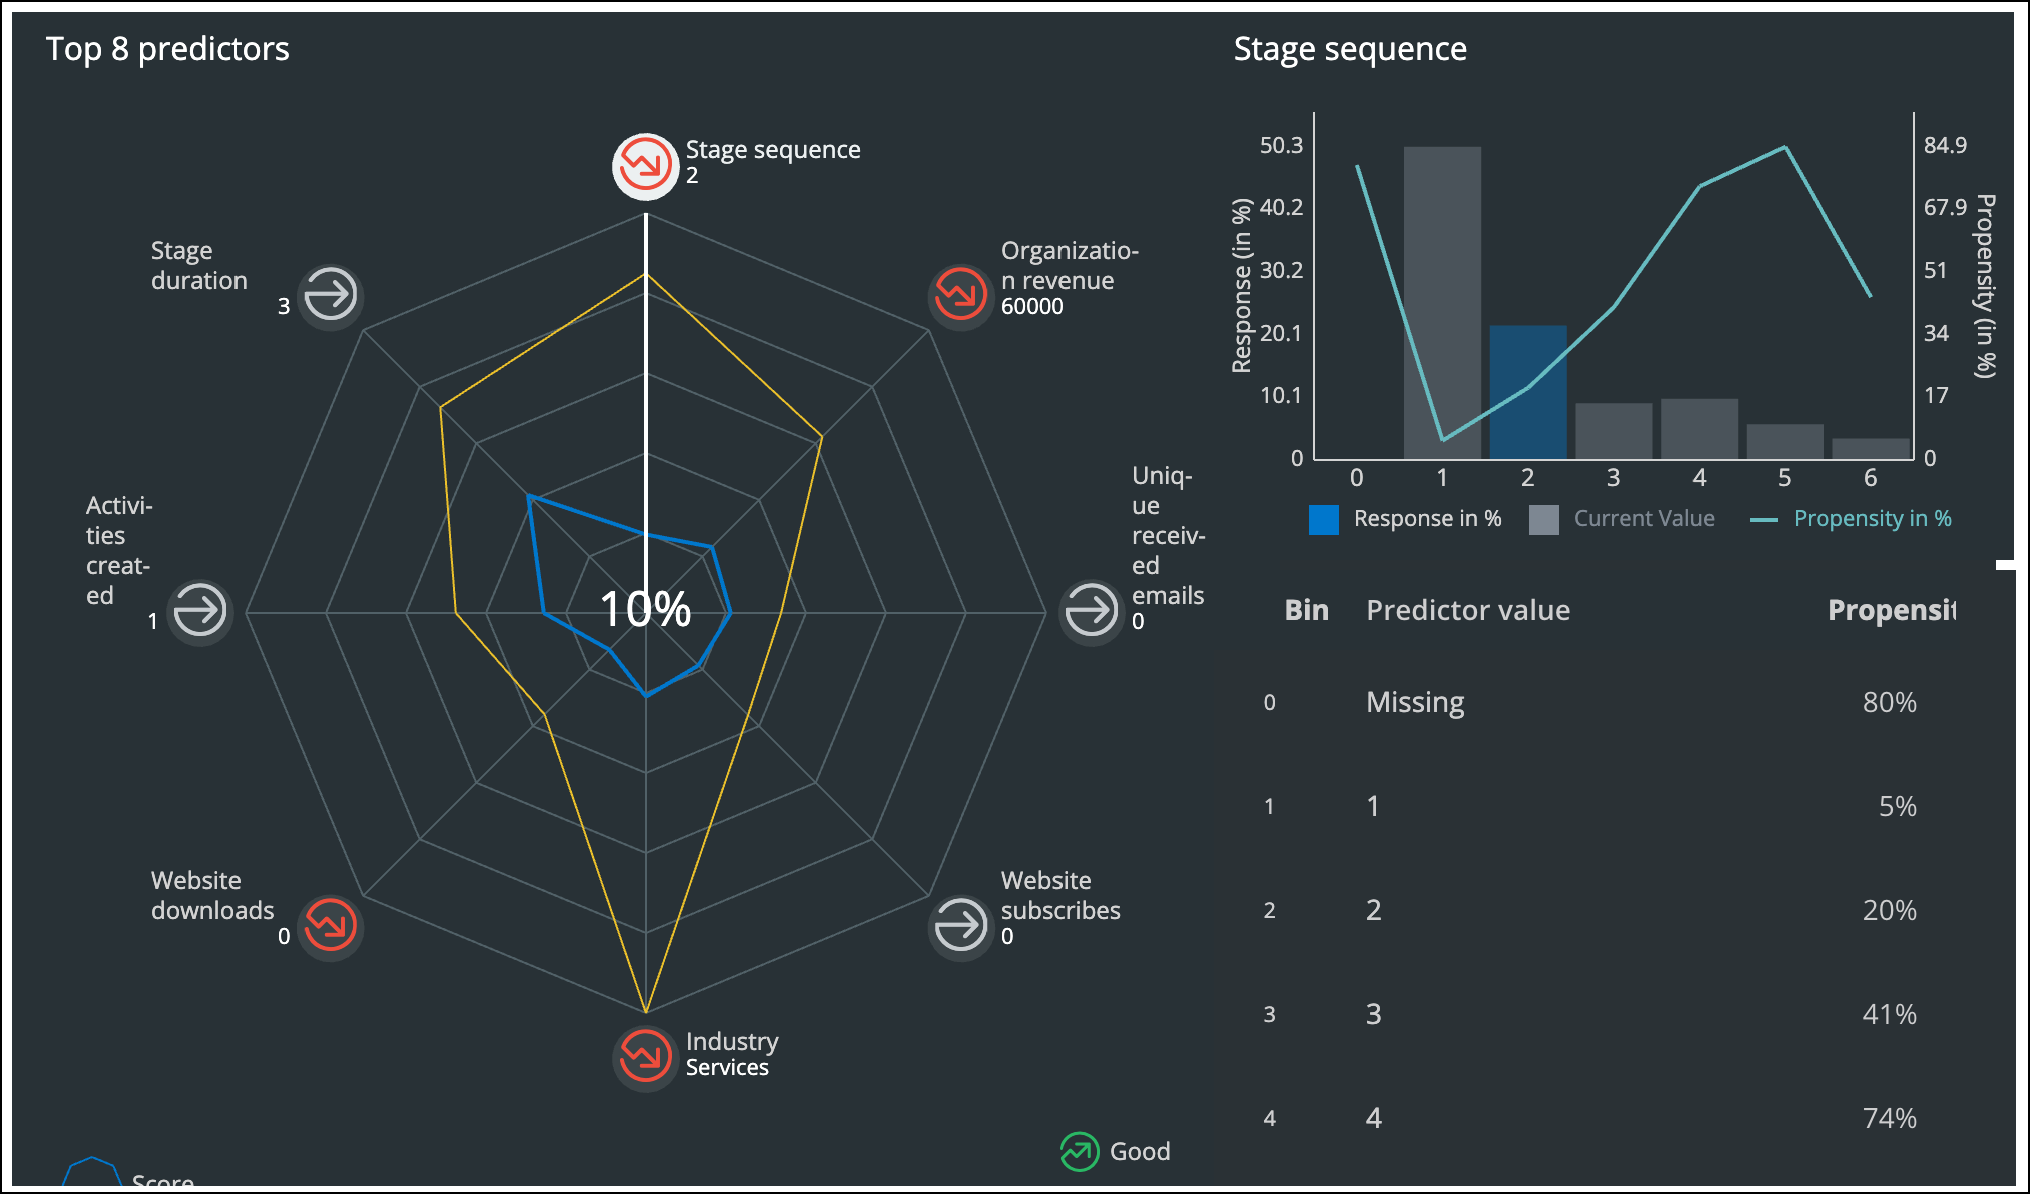
Predictive forecast is based on predictors, for example, ow long n opportunity
spends in each stage of the sales cycle, or how many activities the sales rep
created for this opportunity. Predictors are trained based on the history of all
logged opportunities. For more information, see Artificial intelligence-based opportunity insights.
AI predictors on the opportunity screen
View the opportunity data.
Hover over red warnings to see the data variance details.
The system displays a red warning if the discrepancy between the
predictive and weighted amounts are higher than the set threshold. By
default, discrepancy is set to a 20% variance.
Optional: To see a detailed view of an opportunity in a second table, select any
opportunity in the table.